
Every laganikarta knows the dread of a prolonged NEPSE bear market. When the index is bleeding week after week, Facebook groups are filled with panic, and your portfolio is deeply in the red, it feels like the market will never go up again.
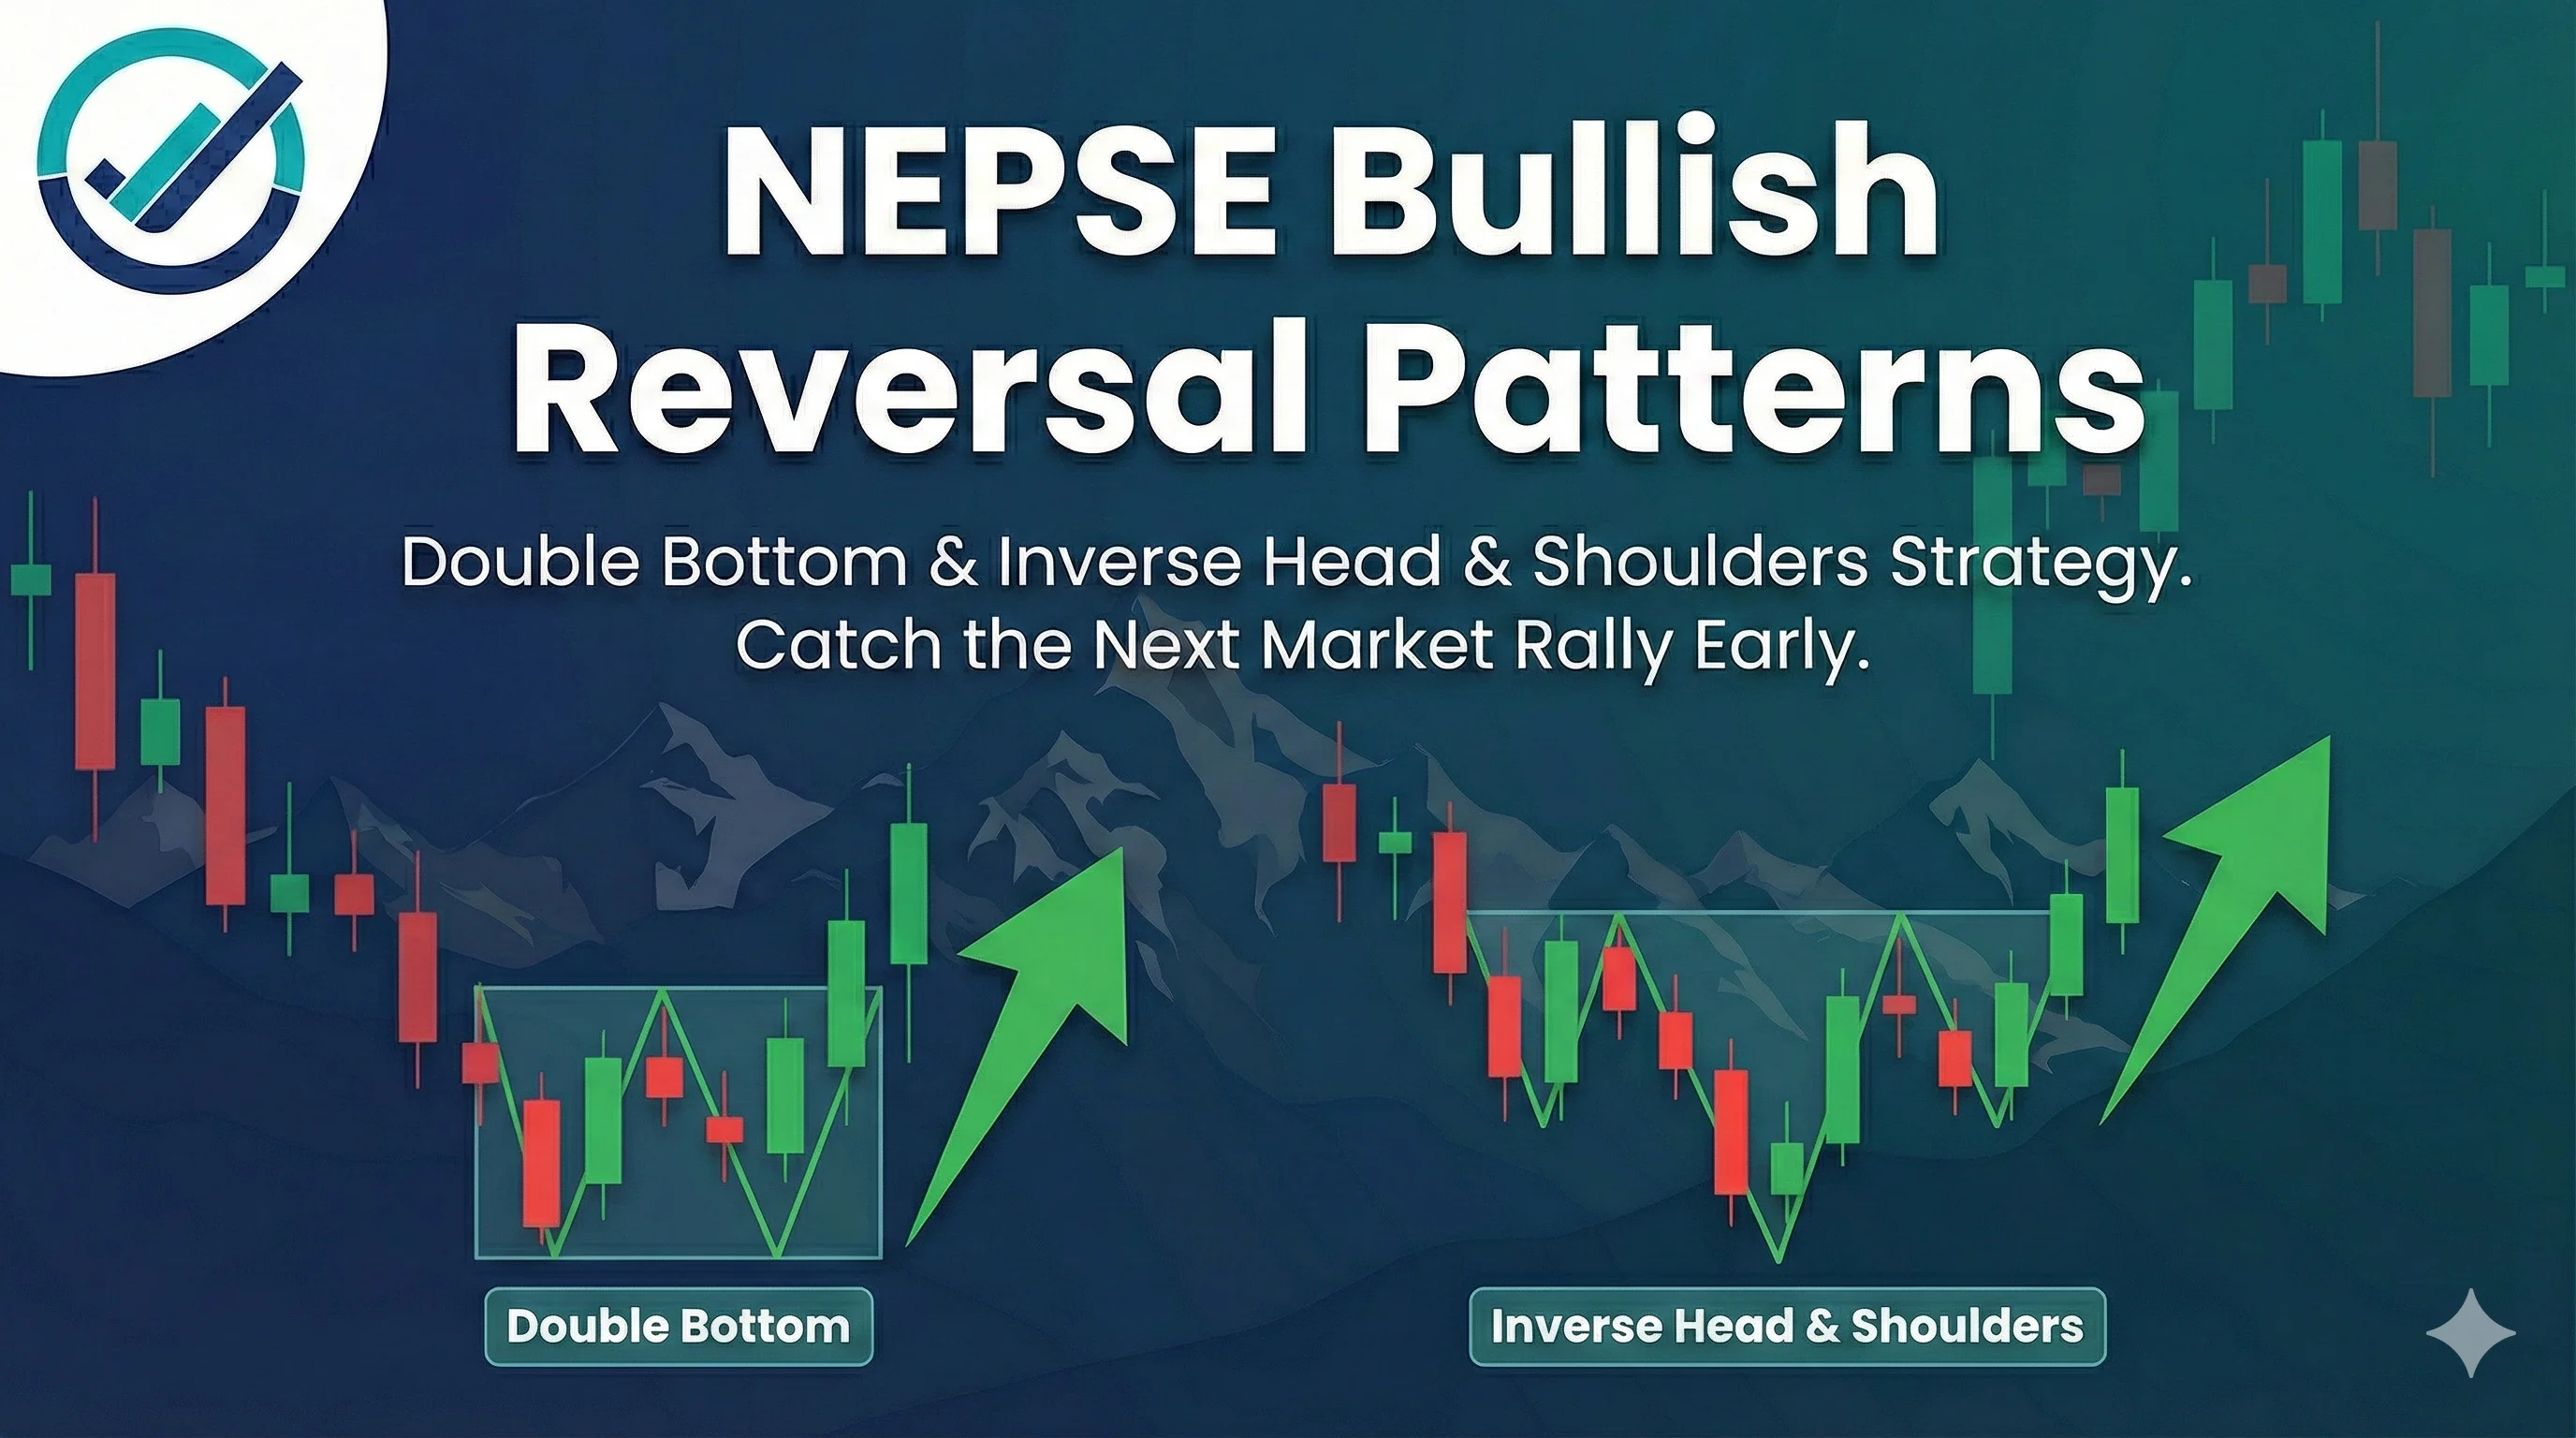
But while retail investors are panic-selling their kitta at a massive loss, the kheladis (smart money and institutional buyers) are quietly looking at the bigger picture. They aren't just looking at single-day candlestick patterns; they are looking for Bullish Reversal Chart Patterns.
Unlike single candlesticks that show a one-day mood swing, chart patterns take weeks or even months to form. They represent a massive, undeniable shift in market psychology. When a bullish reversal pattern completes, it means the sellers are entirely exhausted, a concrete floor has been built, and a new bull run is about to begin.
Here are the four most powerful bullish reversal chart patterns you need to master to catch the absolute bottom in the Nepali share market.
1. The Double Bottom (The "W" Pattern)
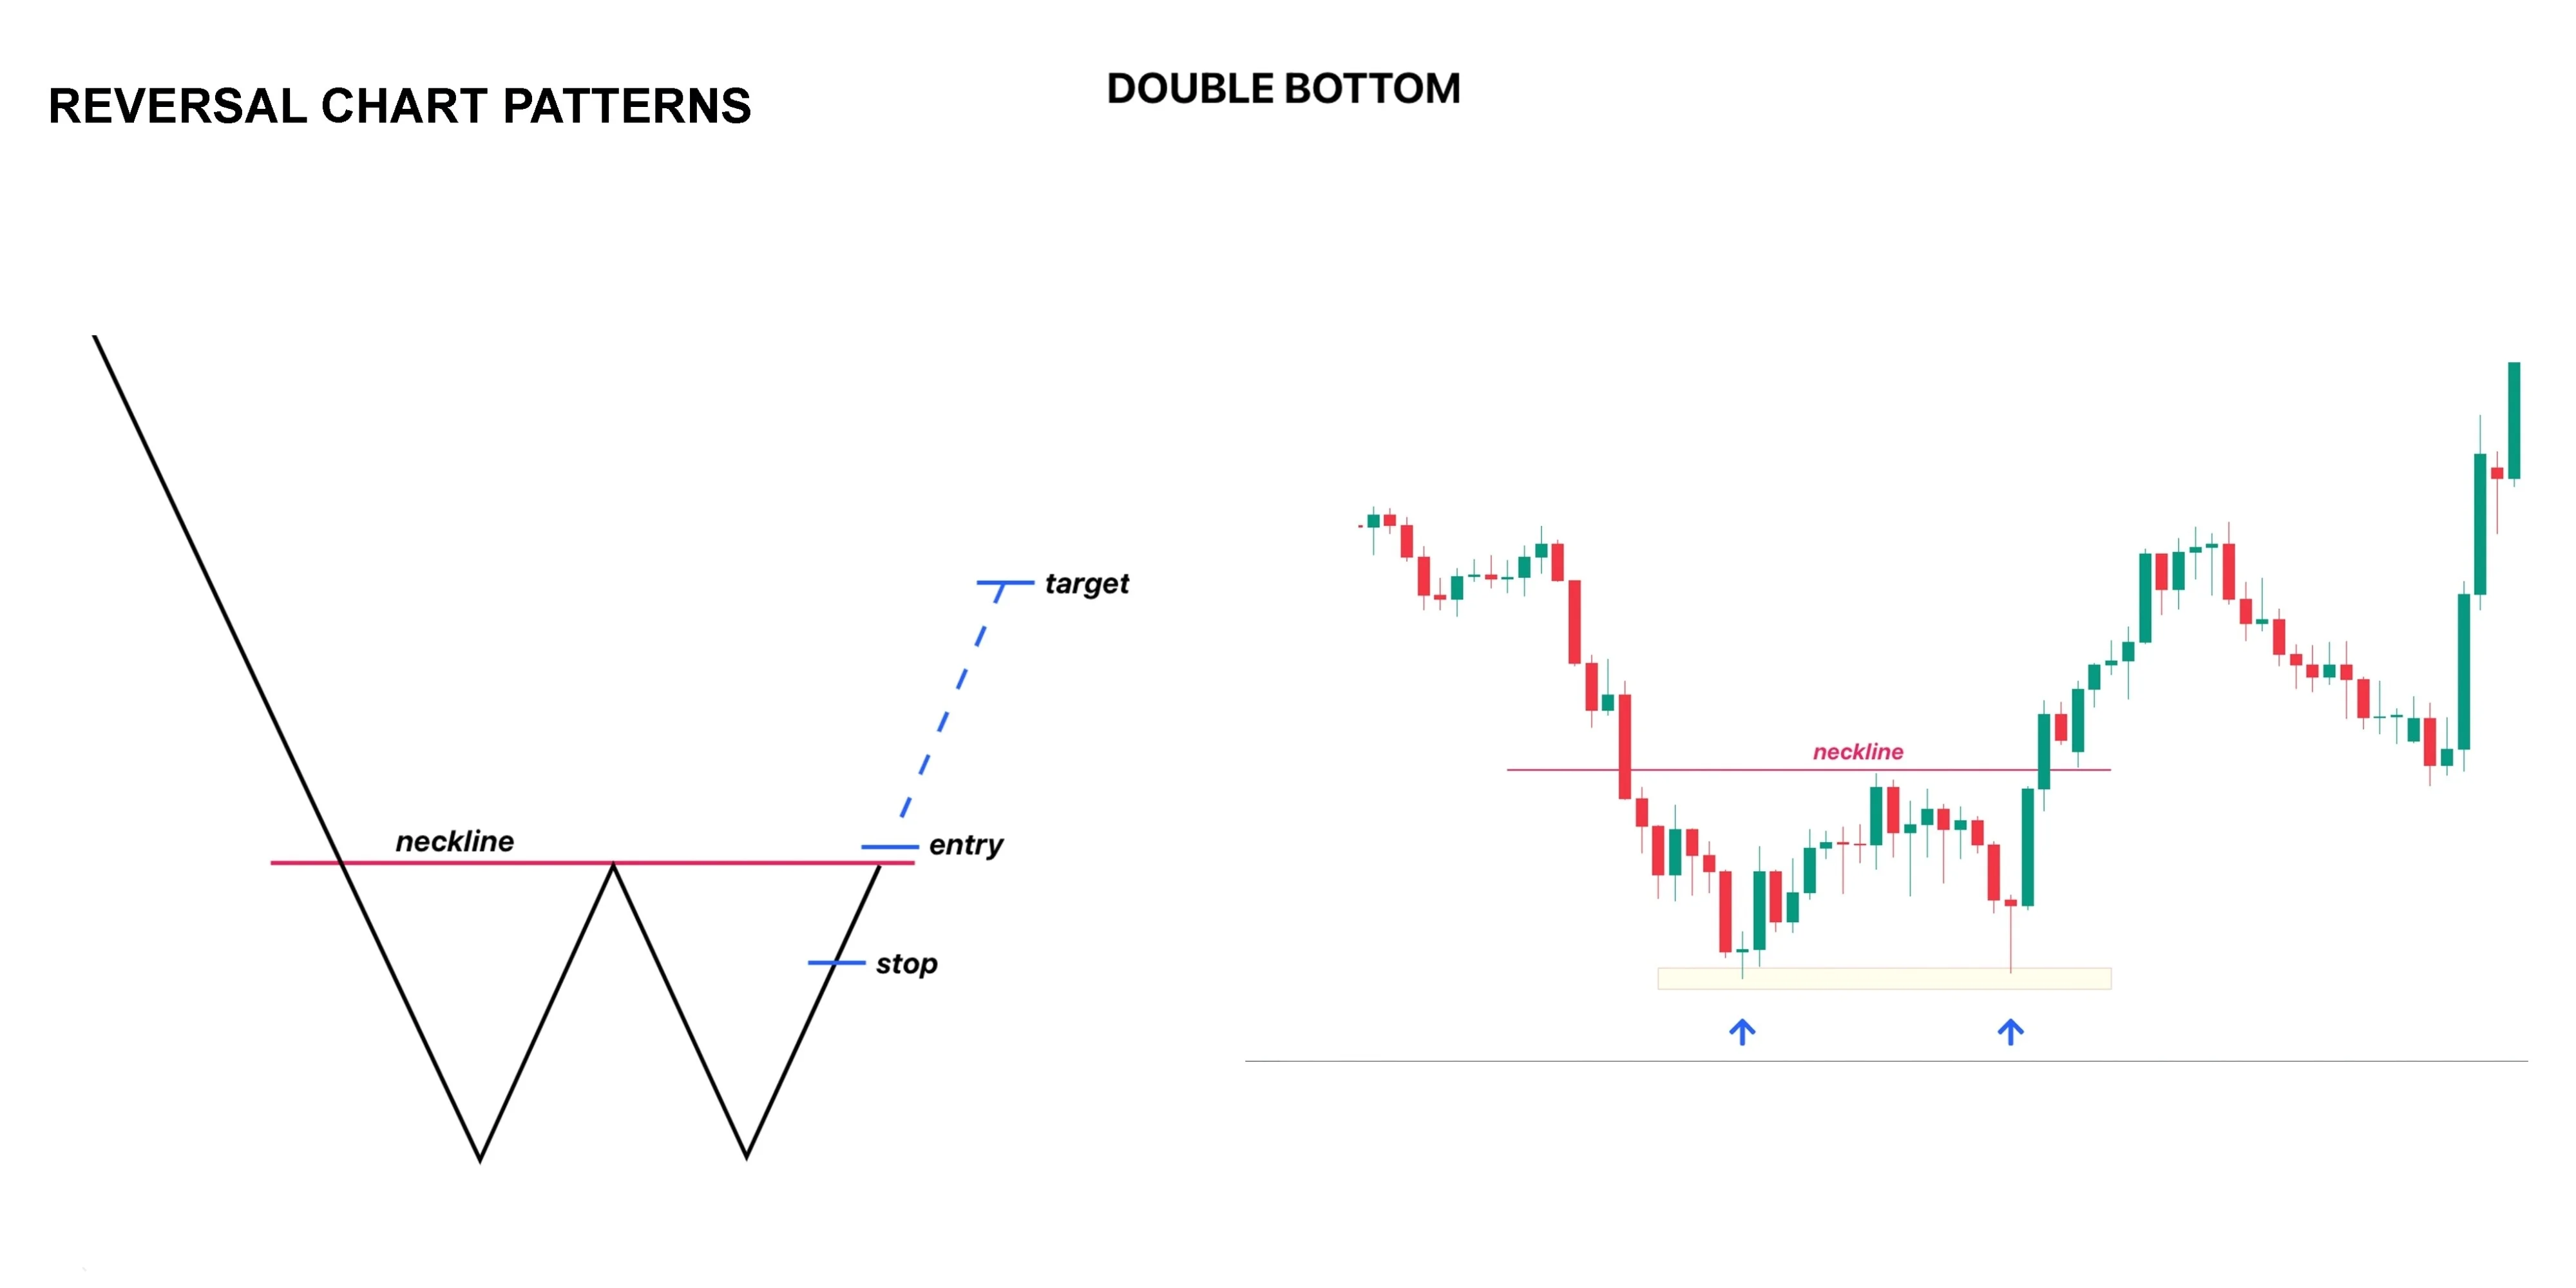
What it looks like: Exactly like the letter "W". The price drops to a specific low, bounces up slightly, drops back down to test that exact same low, and then finally surges upward.
The Psychology in NEPSE: This pattern is the ultimate test of support. During the first drop, sellers pushed the price down, but buyers stepped in. A few weeks later, the sellers tried again to crash the price below that level, but they completely failed. This proves that a solid "floor" has been established (for example, at the Rs. 300 level for a hydropower stock). Because the sellers couldn't break the floor, the buyers take absolute control.
Your Next Move: Wait for the price to break above the "Neckline" (the middle peak of the "W"). Once the stock breaks that neckline with high trading volume on your TMS, it is a confirmed buy signal.
Deep Dive: 👉 Read our complete strategy guide on trading the Double Bottom Pattern here.
2. The Inverse Head and Shoulders
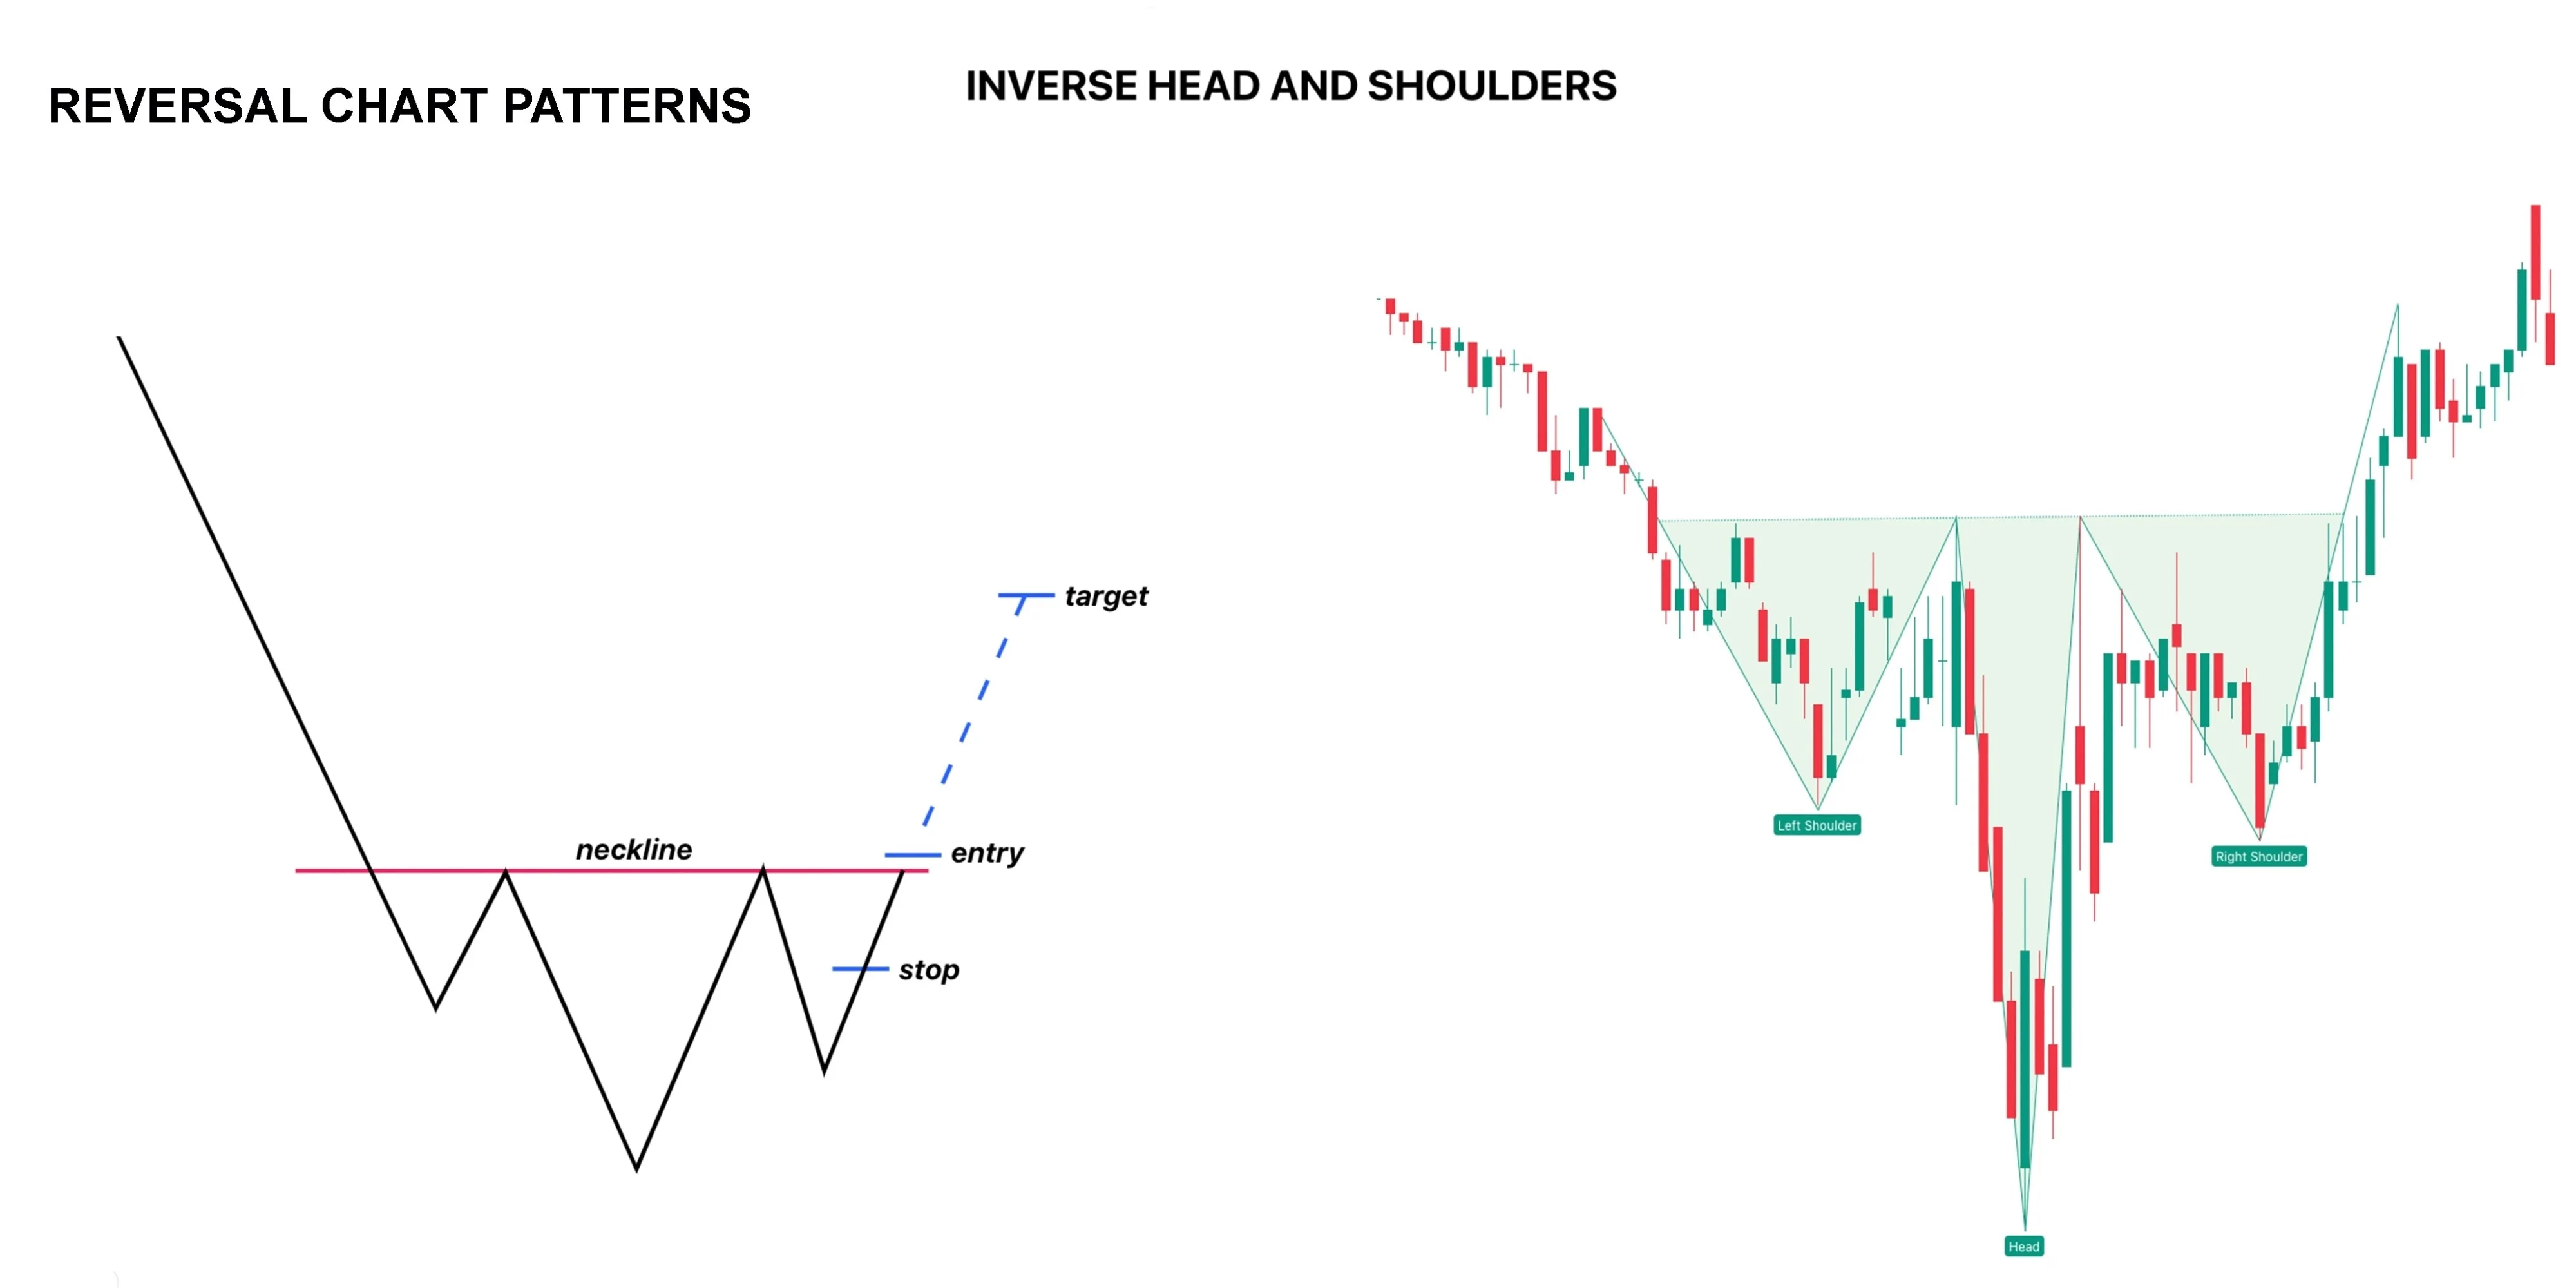
What it looks like: A three-part bottoming structure. It consists of a "Left Shoulder" (a drop and bounce), a "Head" (a much deeper drop and bounce), and a "Right Shoulder" (a shallower drop that fails to reach the bottom of the Head).
The Psychology in NEPSE: This pattern beautifully illustrates the slow death of a downtrend.
Left Shoulder: Normal bear market selling.
Head: Ultimate panic selling. Retail traders capitulate, but smart money buys heavily at the absolute bottom.
Right Shoulder: Sellers try to push the price back down to the panic lows, but they fail. The bulls step in much earlier, creating a "higher low." The momentum has officially shifted.
Your Next Move: Draw a resistance line connecting the peaks between the shoulders (the Neckline). When a strong green candle breaks through this neckline, it's time to accumulate your shares.
Deep Dive: 👉 Master the Inverse Head and Shoulders pattern and learn to calculate price targets here.
3. The Falling Wedge
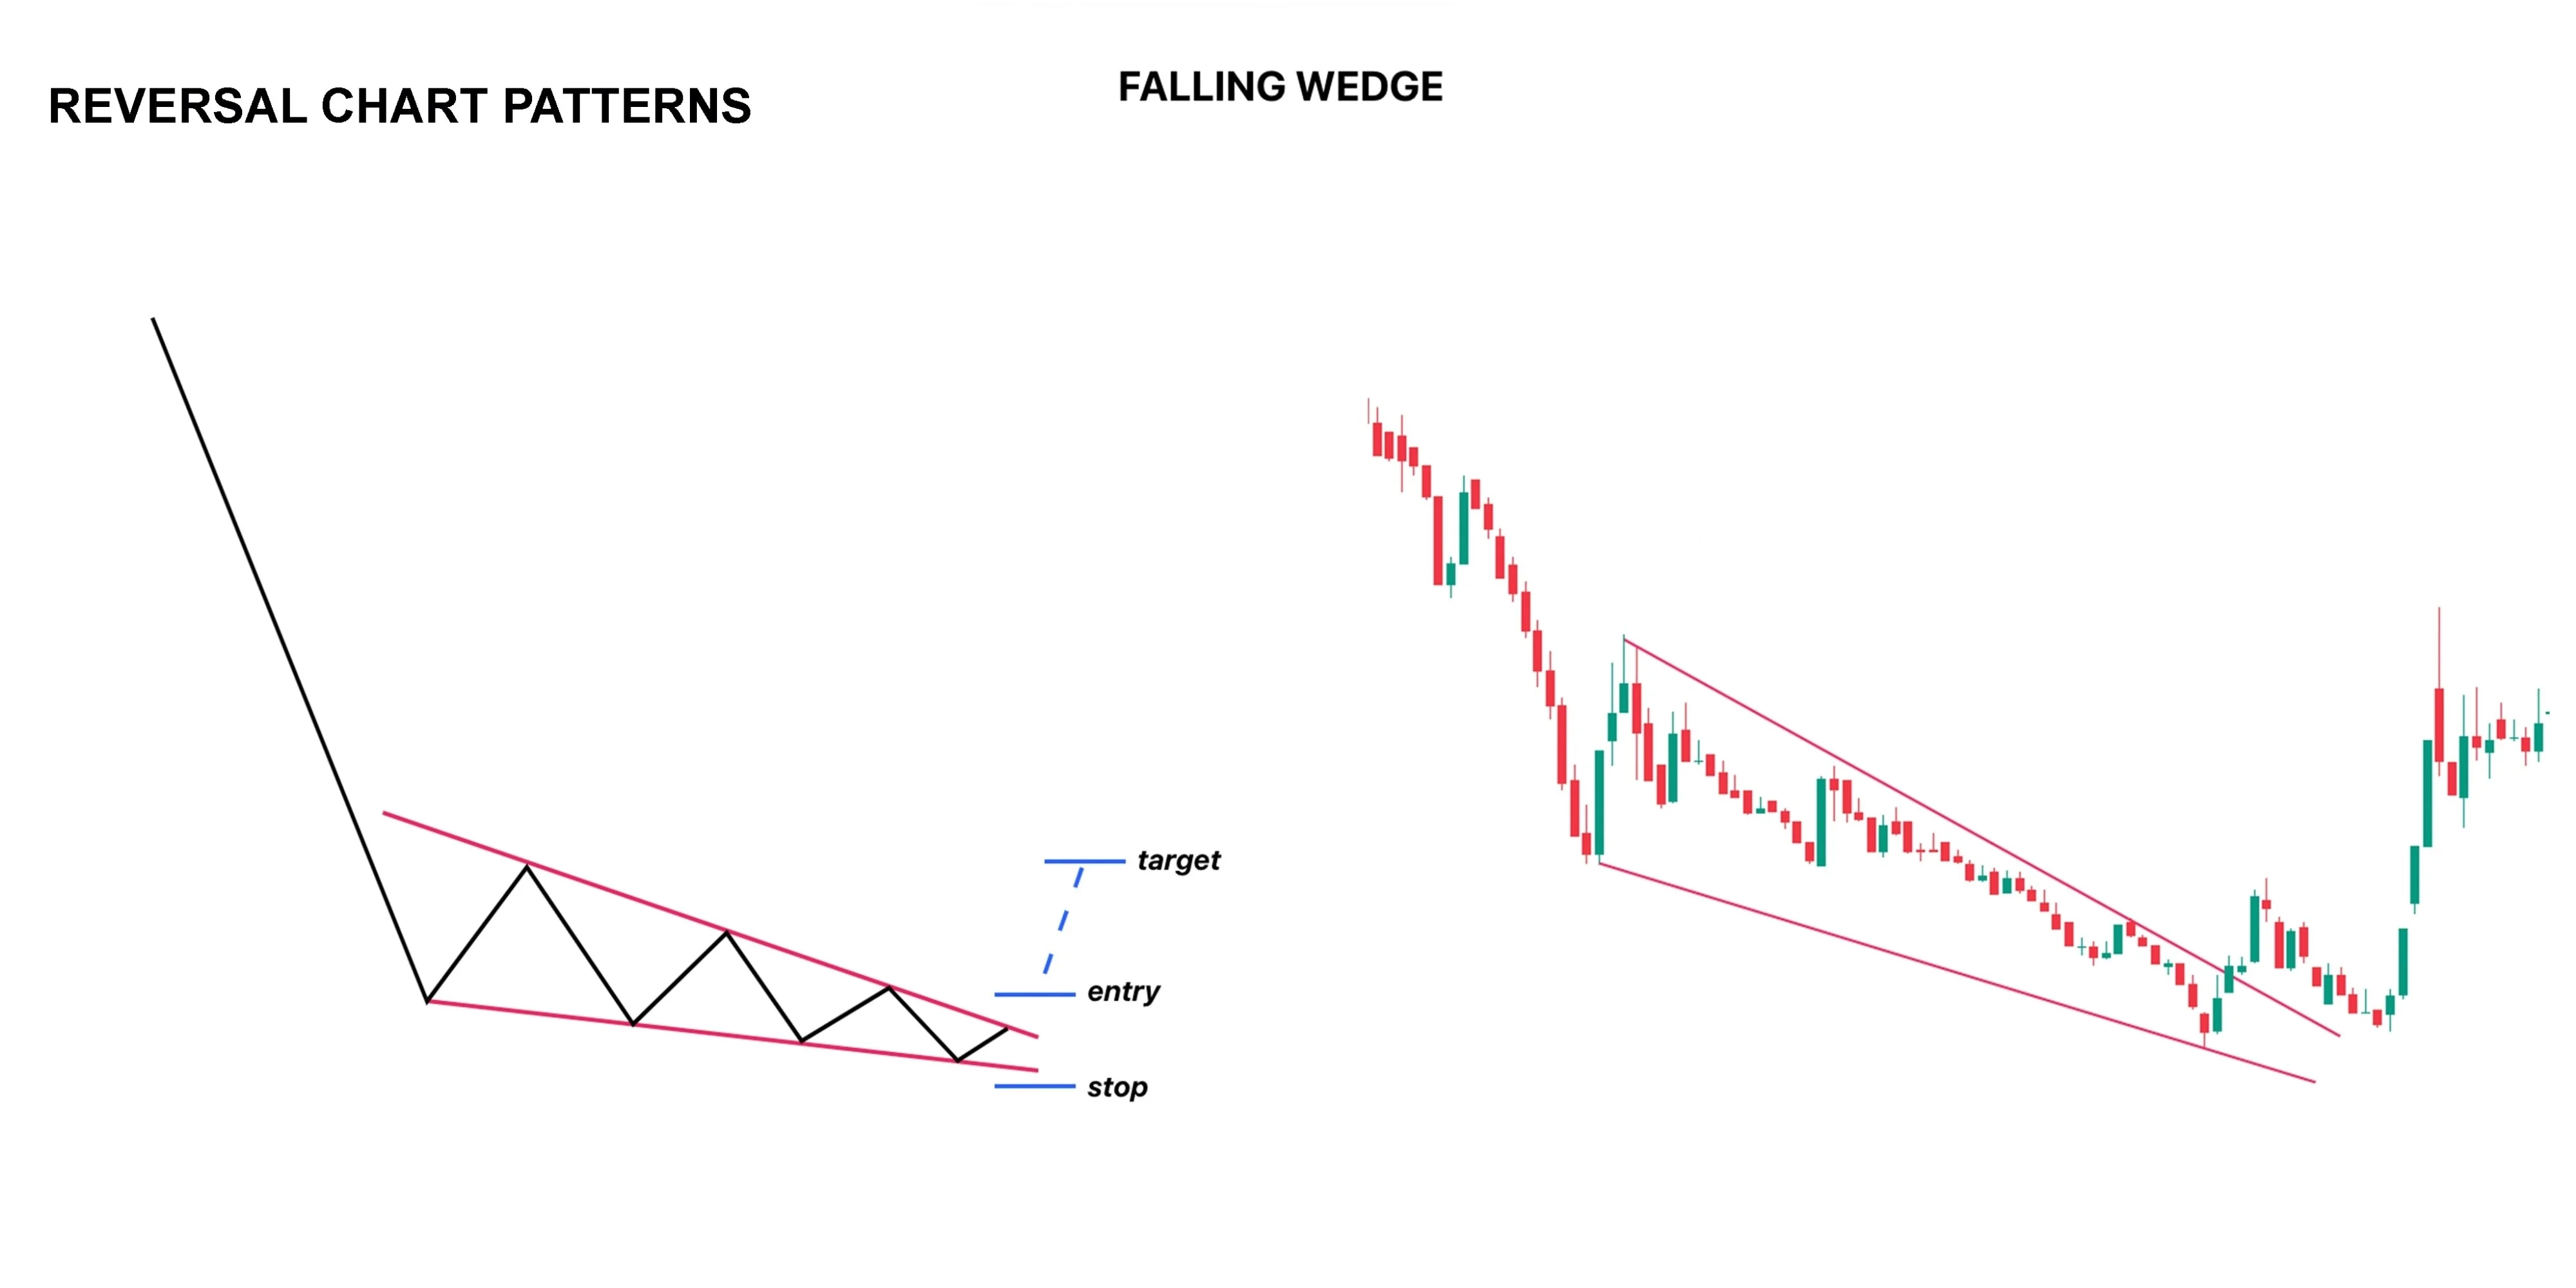
What it looks like: A cone shape that points downwards. The price is making lower highs and lower lows, but the distance between the highs and lows is getting tighter and tighter.
The Psychology in NEPSE: Imagine compressing a spring. The market is still going down, but the selling pressure is losing its strength. The bears are struggling to push the price significantly lower than the previous drop. As the wedge gets tighter, volatility shrinks. Eventually, the sellers run out of kitta, the spring snaps, and the buyers trigger an explosive breakout to the upside.
Your Next Move: Draw your upper trendline (connecting the lower highs) and your lower trendline (connecting the lower lows). The moment the stock breaks above the upper trendline with a surge in volume, execute your buy order.
Deep Dive: 👉 Learn how to spot and trade the explosive Falling Wedge breakout here.
4. The Rounding Bottom (The "Saucer")
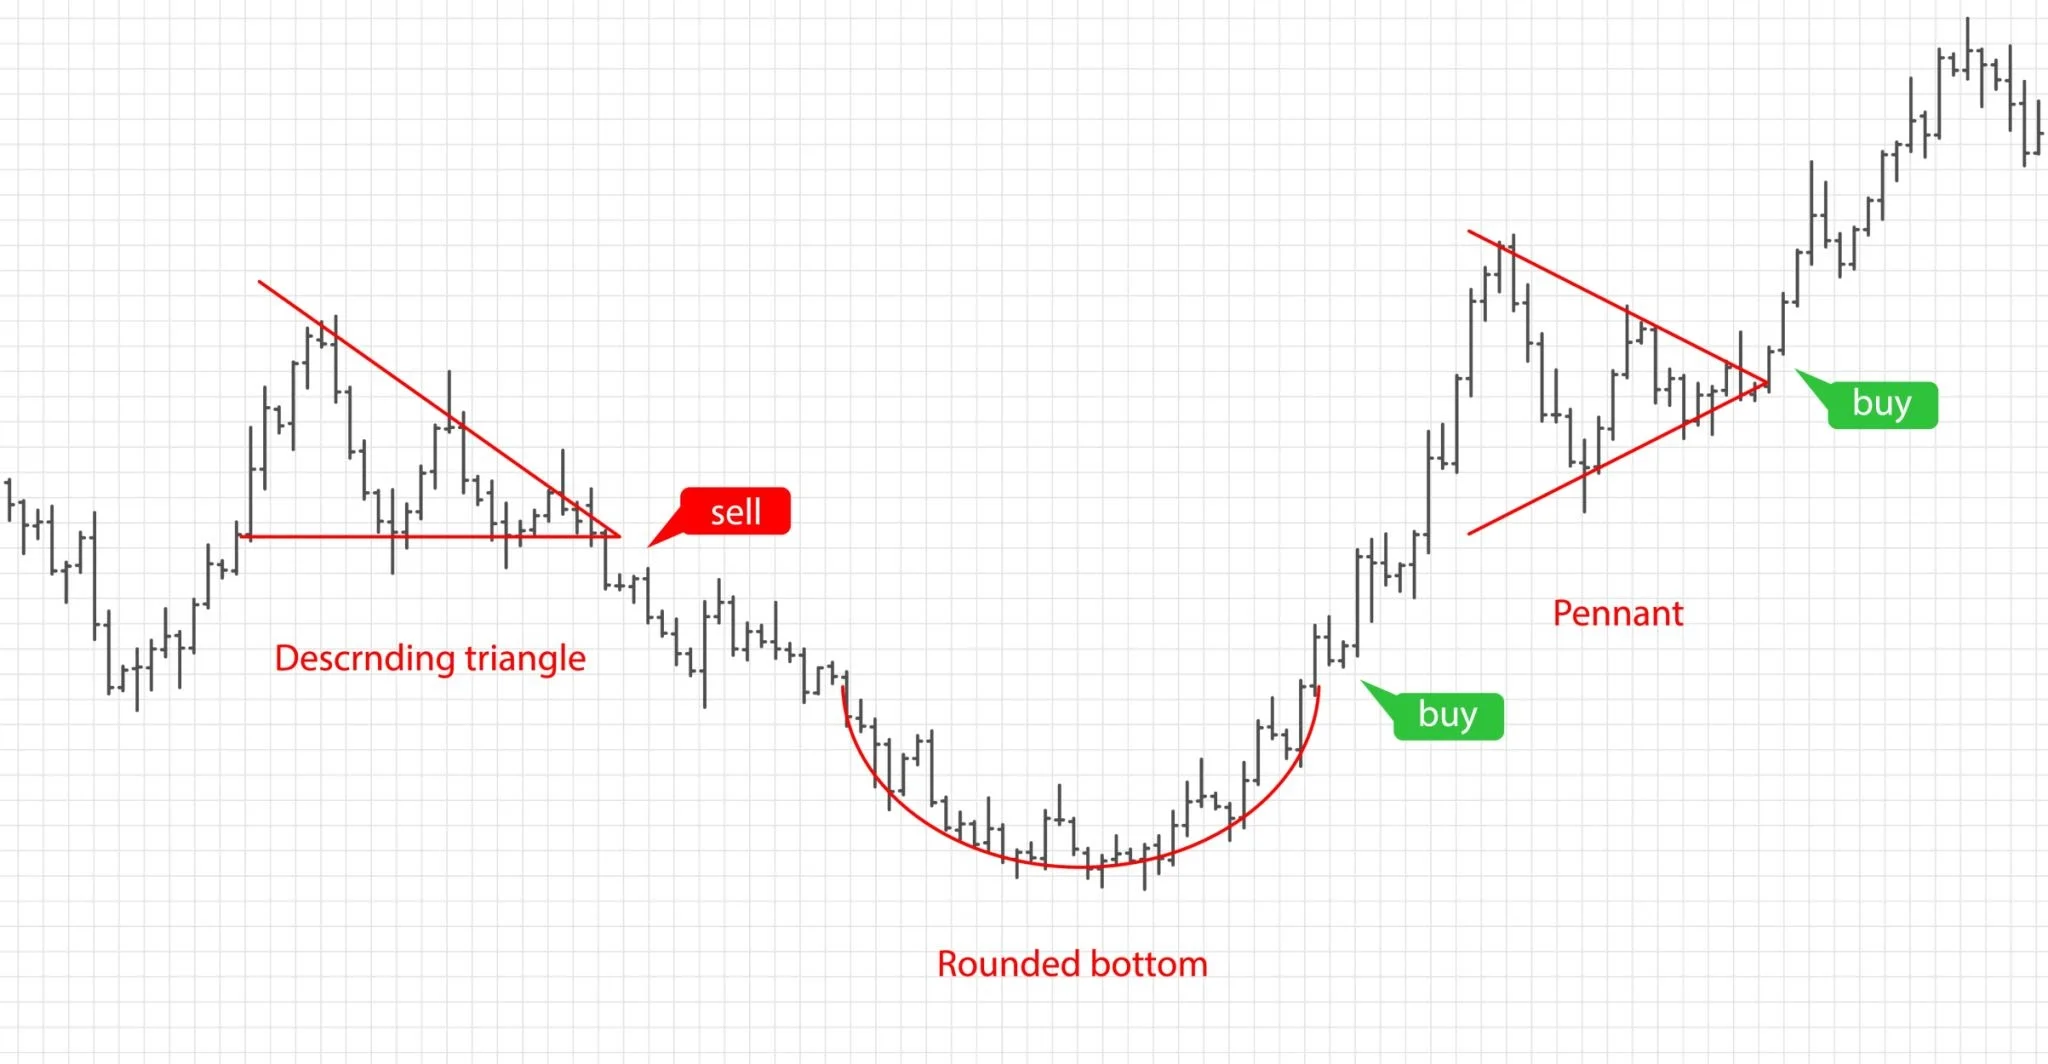
What it looks like: A long, slow, bowl-shaped or "saucer" curve. Unlike the sharp "V" or "W" shapes, this pattern takes a long time to form, sometimes taking several months on a NEPSE daily or weekly chart.
The Psychology in NEPSE: The Rounding Bottom represents a slow, invisible transition of power. The market drops, but instead of a violent bounce, it just goes sideways in a slow curve. Why? Because mutual funds and institutional buyers are quietly accumulating shares. They buy slowly over several weeks so they don't accidentally spike the price. Once they have secured their positions, the supply dries up, and the stock slowly curves upward before breaking out into a massive bull run.
Your Next Move: Patience is key. Wait for the price to reach the "Lip" of the saucer (the resistance level where the initial drop started). A breakout above this lip confirms the start of a long-term uptrend.
Deep Dive: 👉 Discover how to trade the Rounding Bottom for long-term portfolio growth here.
5. The Triple Bottom: The Ultimate Support
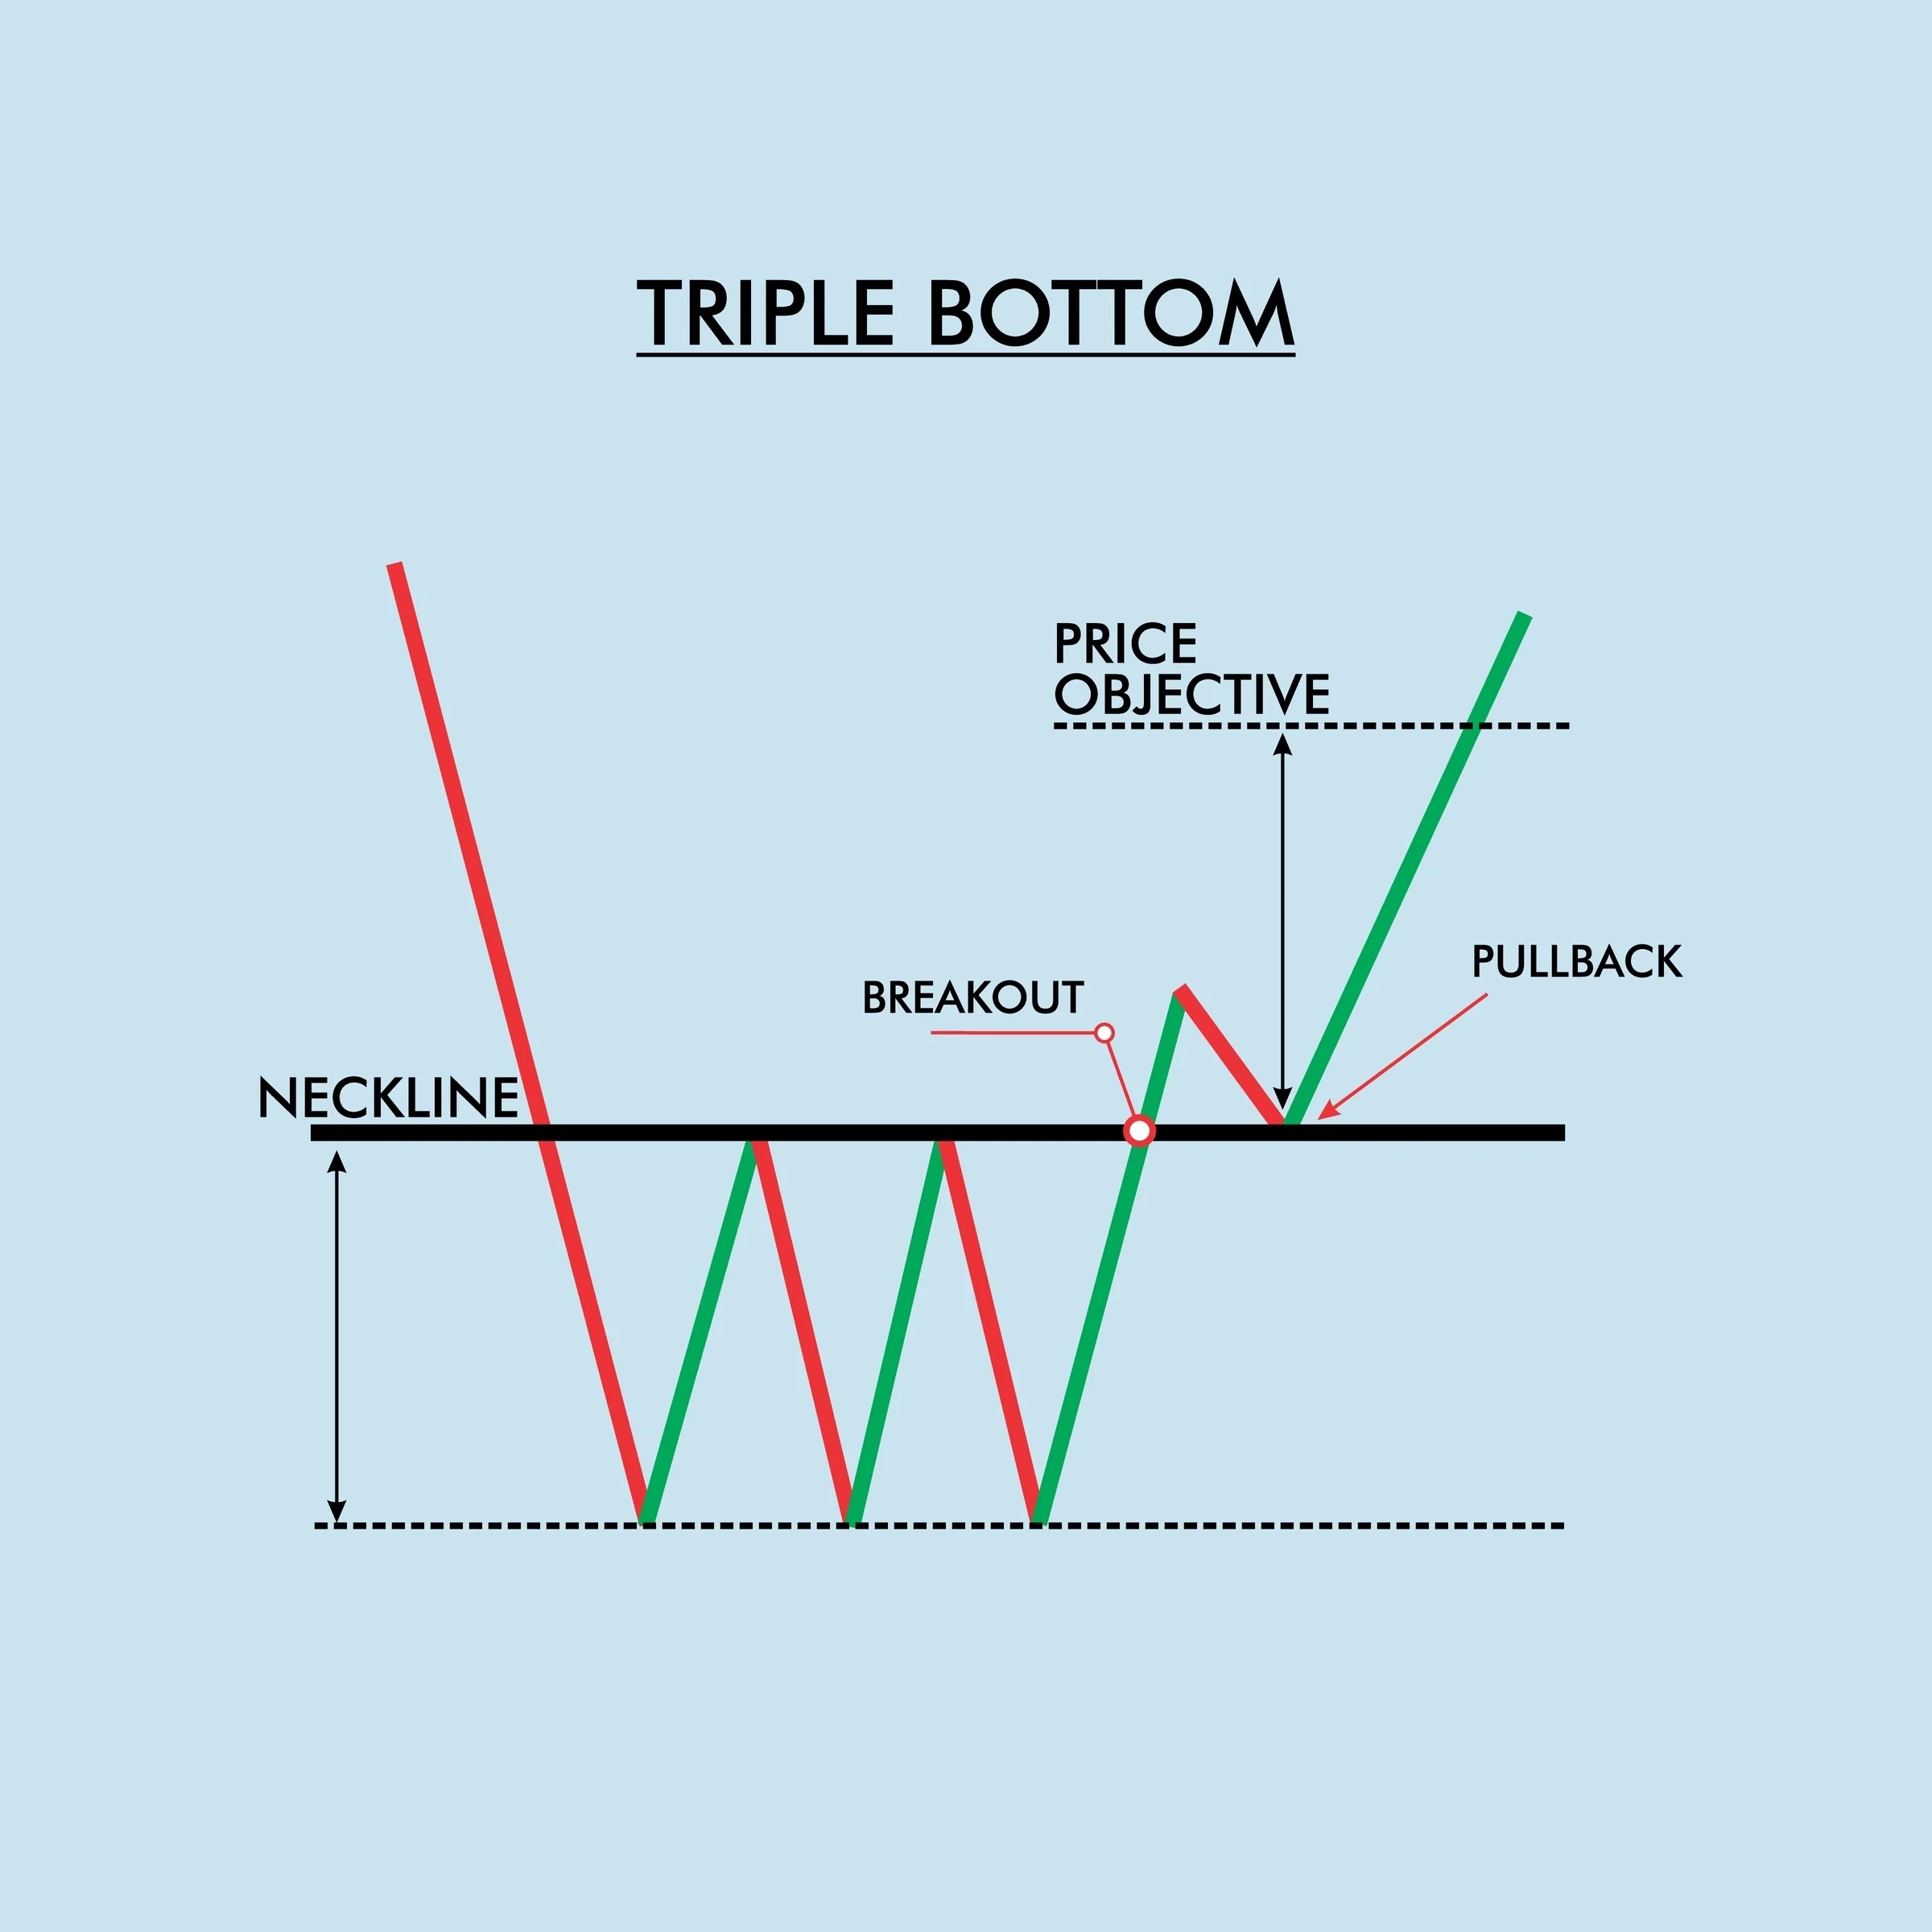
What it looks like: The price drops to the exact same support level three separate times, creating three deep valleys (like a "W" with an extra leg), before finally surging above the upper resistance line (the neckline).
The Psychology in NEPSE: The third drop creates pure panic. Retail laganikartas assume the support will finally break and rush to sell. However, smart money happily steps in to absorb all those discounted shares. When the sellers fail for a third time to push the price lower, it proves they are completely exhausted, setting the stage for a massive bullish reversal.
Your Next Move: Never try to buy exactly at the third bottom—it's too risky. Keep the scrip on your watchlist and wait for a daily candle to confidently break above the neckline with high trading volume before you buy.
➡️ Read our full guide on how to trade the Triple Bottom shakeout here.
6. The Bull Flag: How to Safely Buy the Dip
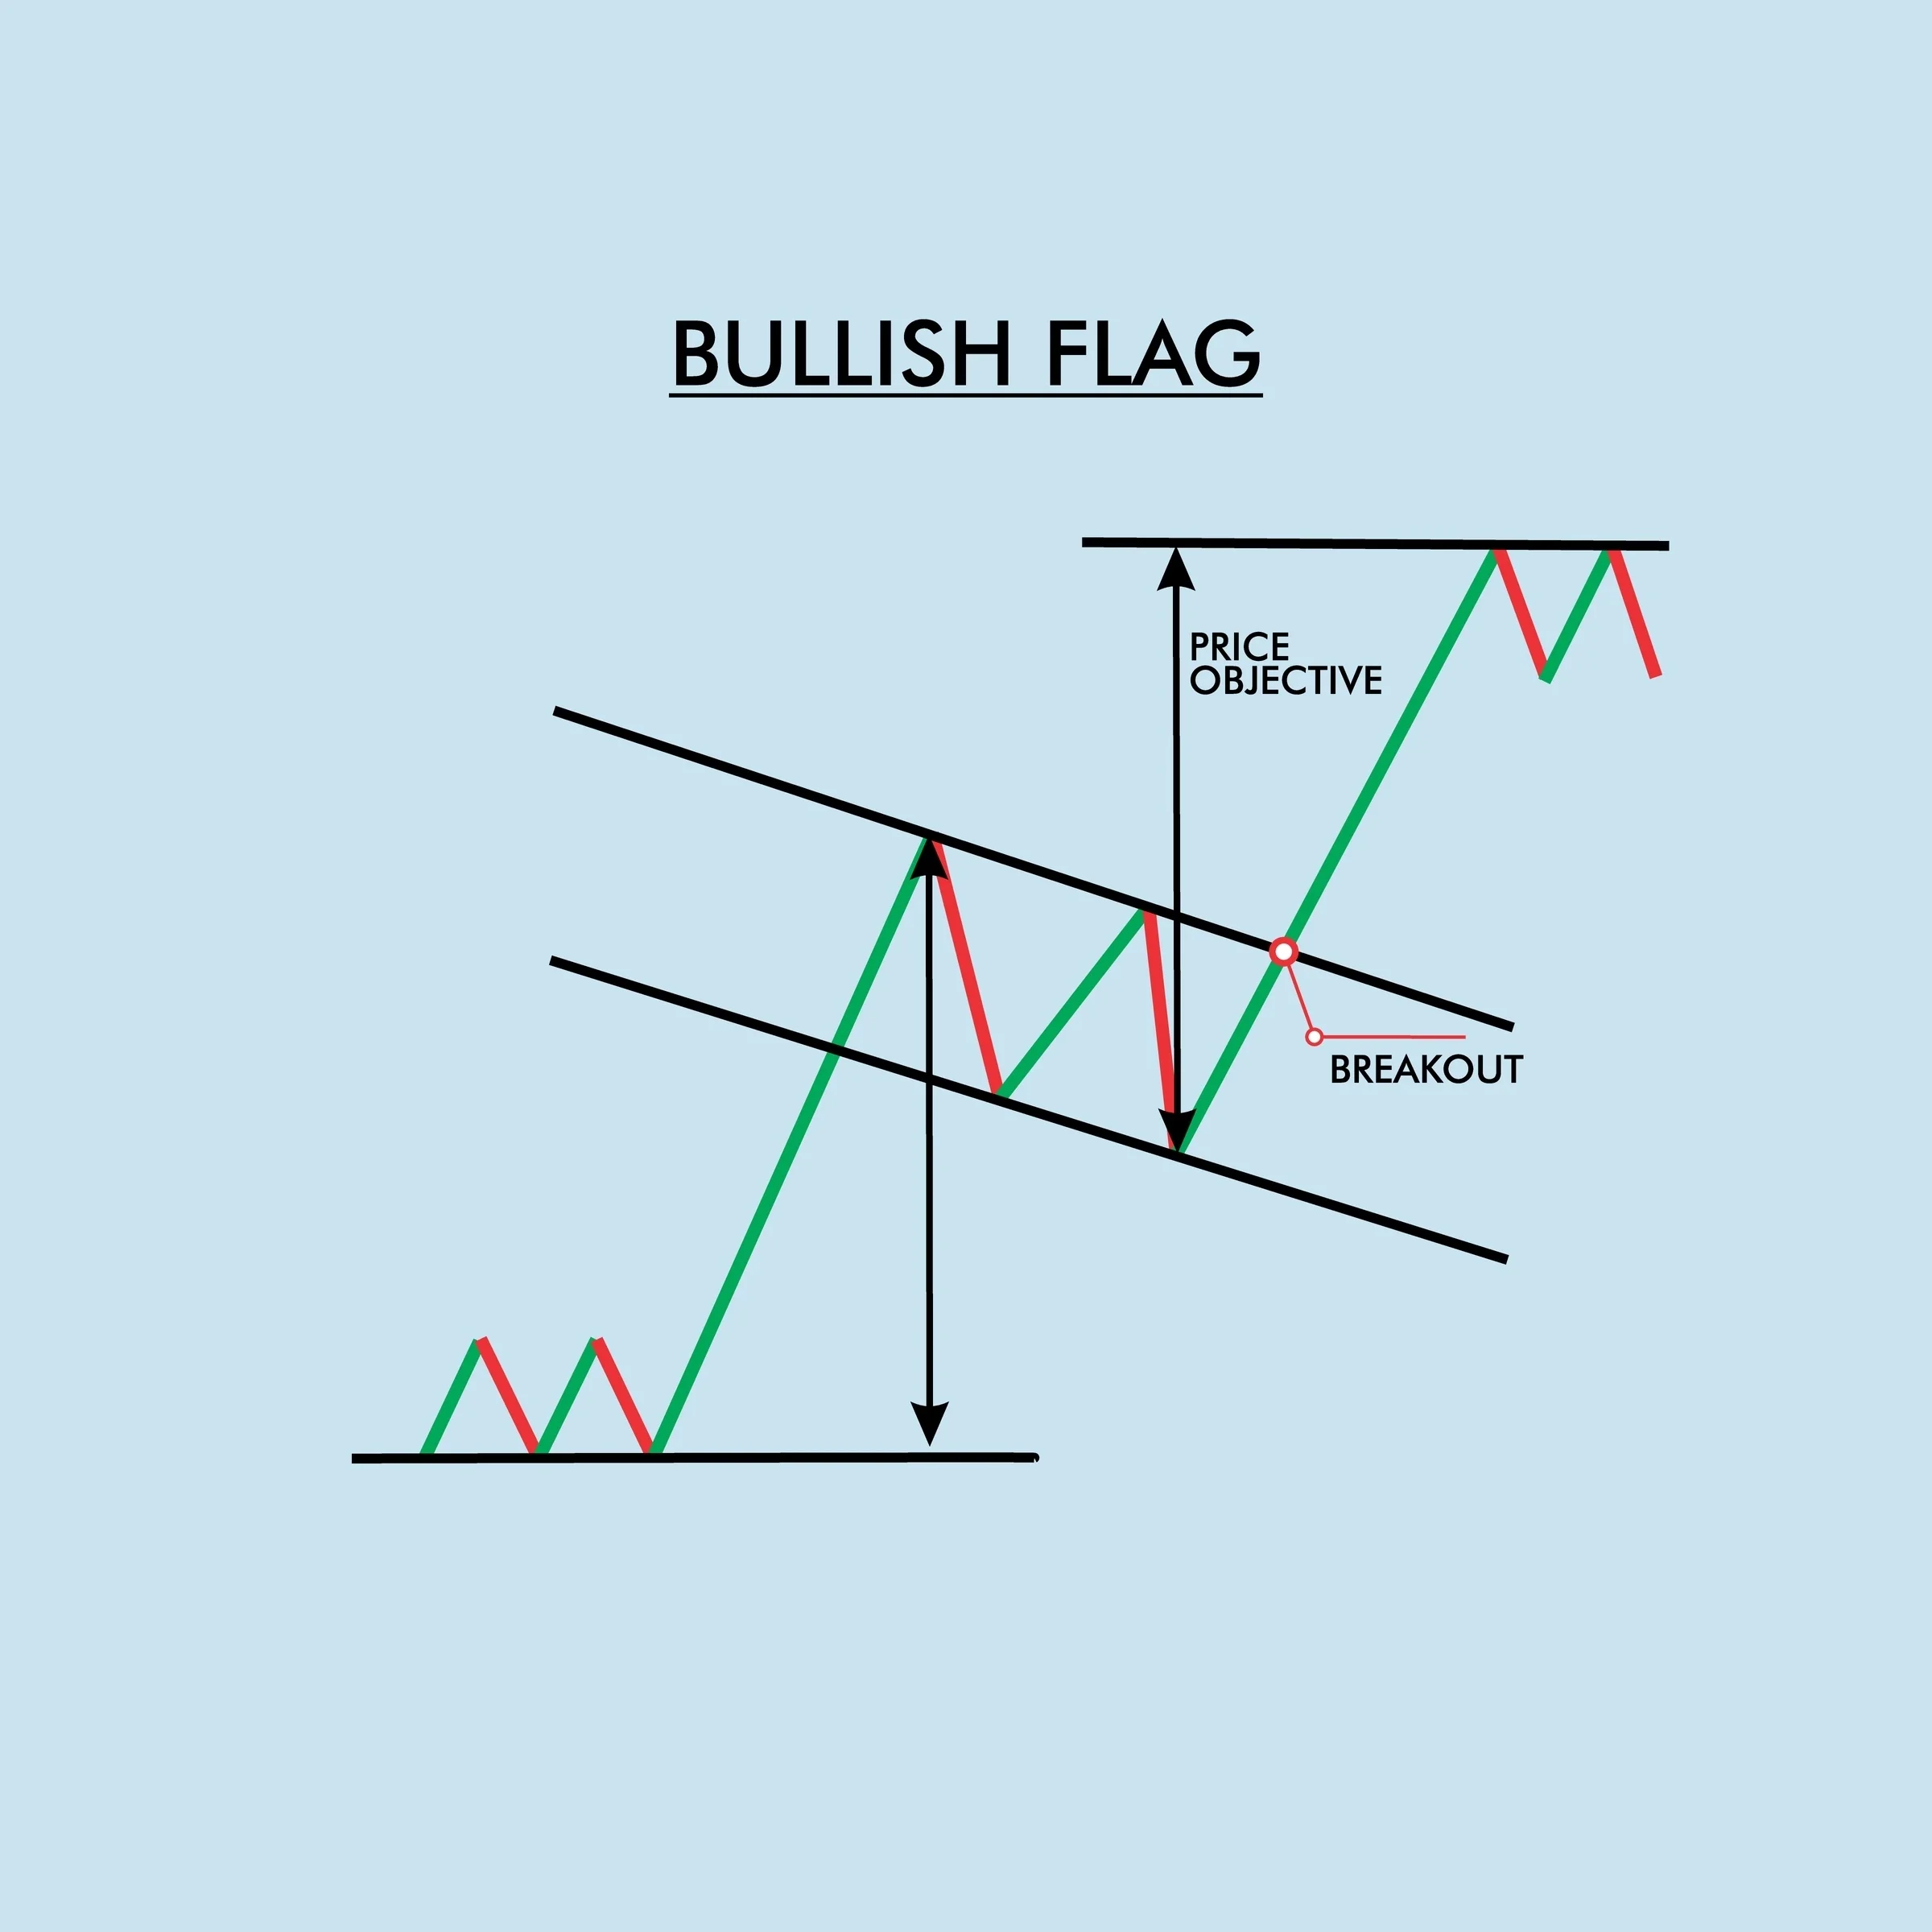
What it looks like: A massive, near-vertical price surge (the flagpole) followed by a slow, orderly downward drift where the price bounces between two parallel, downward-sloping trendlines (the flag).
The Psychology in NEPSE: After a massive surge, early retail buyers start booking their quick profits, causing the price to drift lower. However, smart money knows the rally isn't over. They quietly absorb all the selling pressure, keeping the drop controlled rather than letting it crash. Once the profit-takers run out of shares to sell, aggressive buying resumes, triggering the next massive leg up.
Your Next Move: Do not buy while the stock is still drifting downward inside the flag. Wait patiently for a daily candlestick to close clearly above the upper trendline with a spike in volume before buying the breakout.
➡️ Master the Bull Flag and learn how to safely buy the dip here.
7. The Bullish Pennant: Riding the High-Speed Squeeze
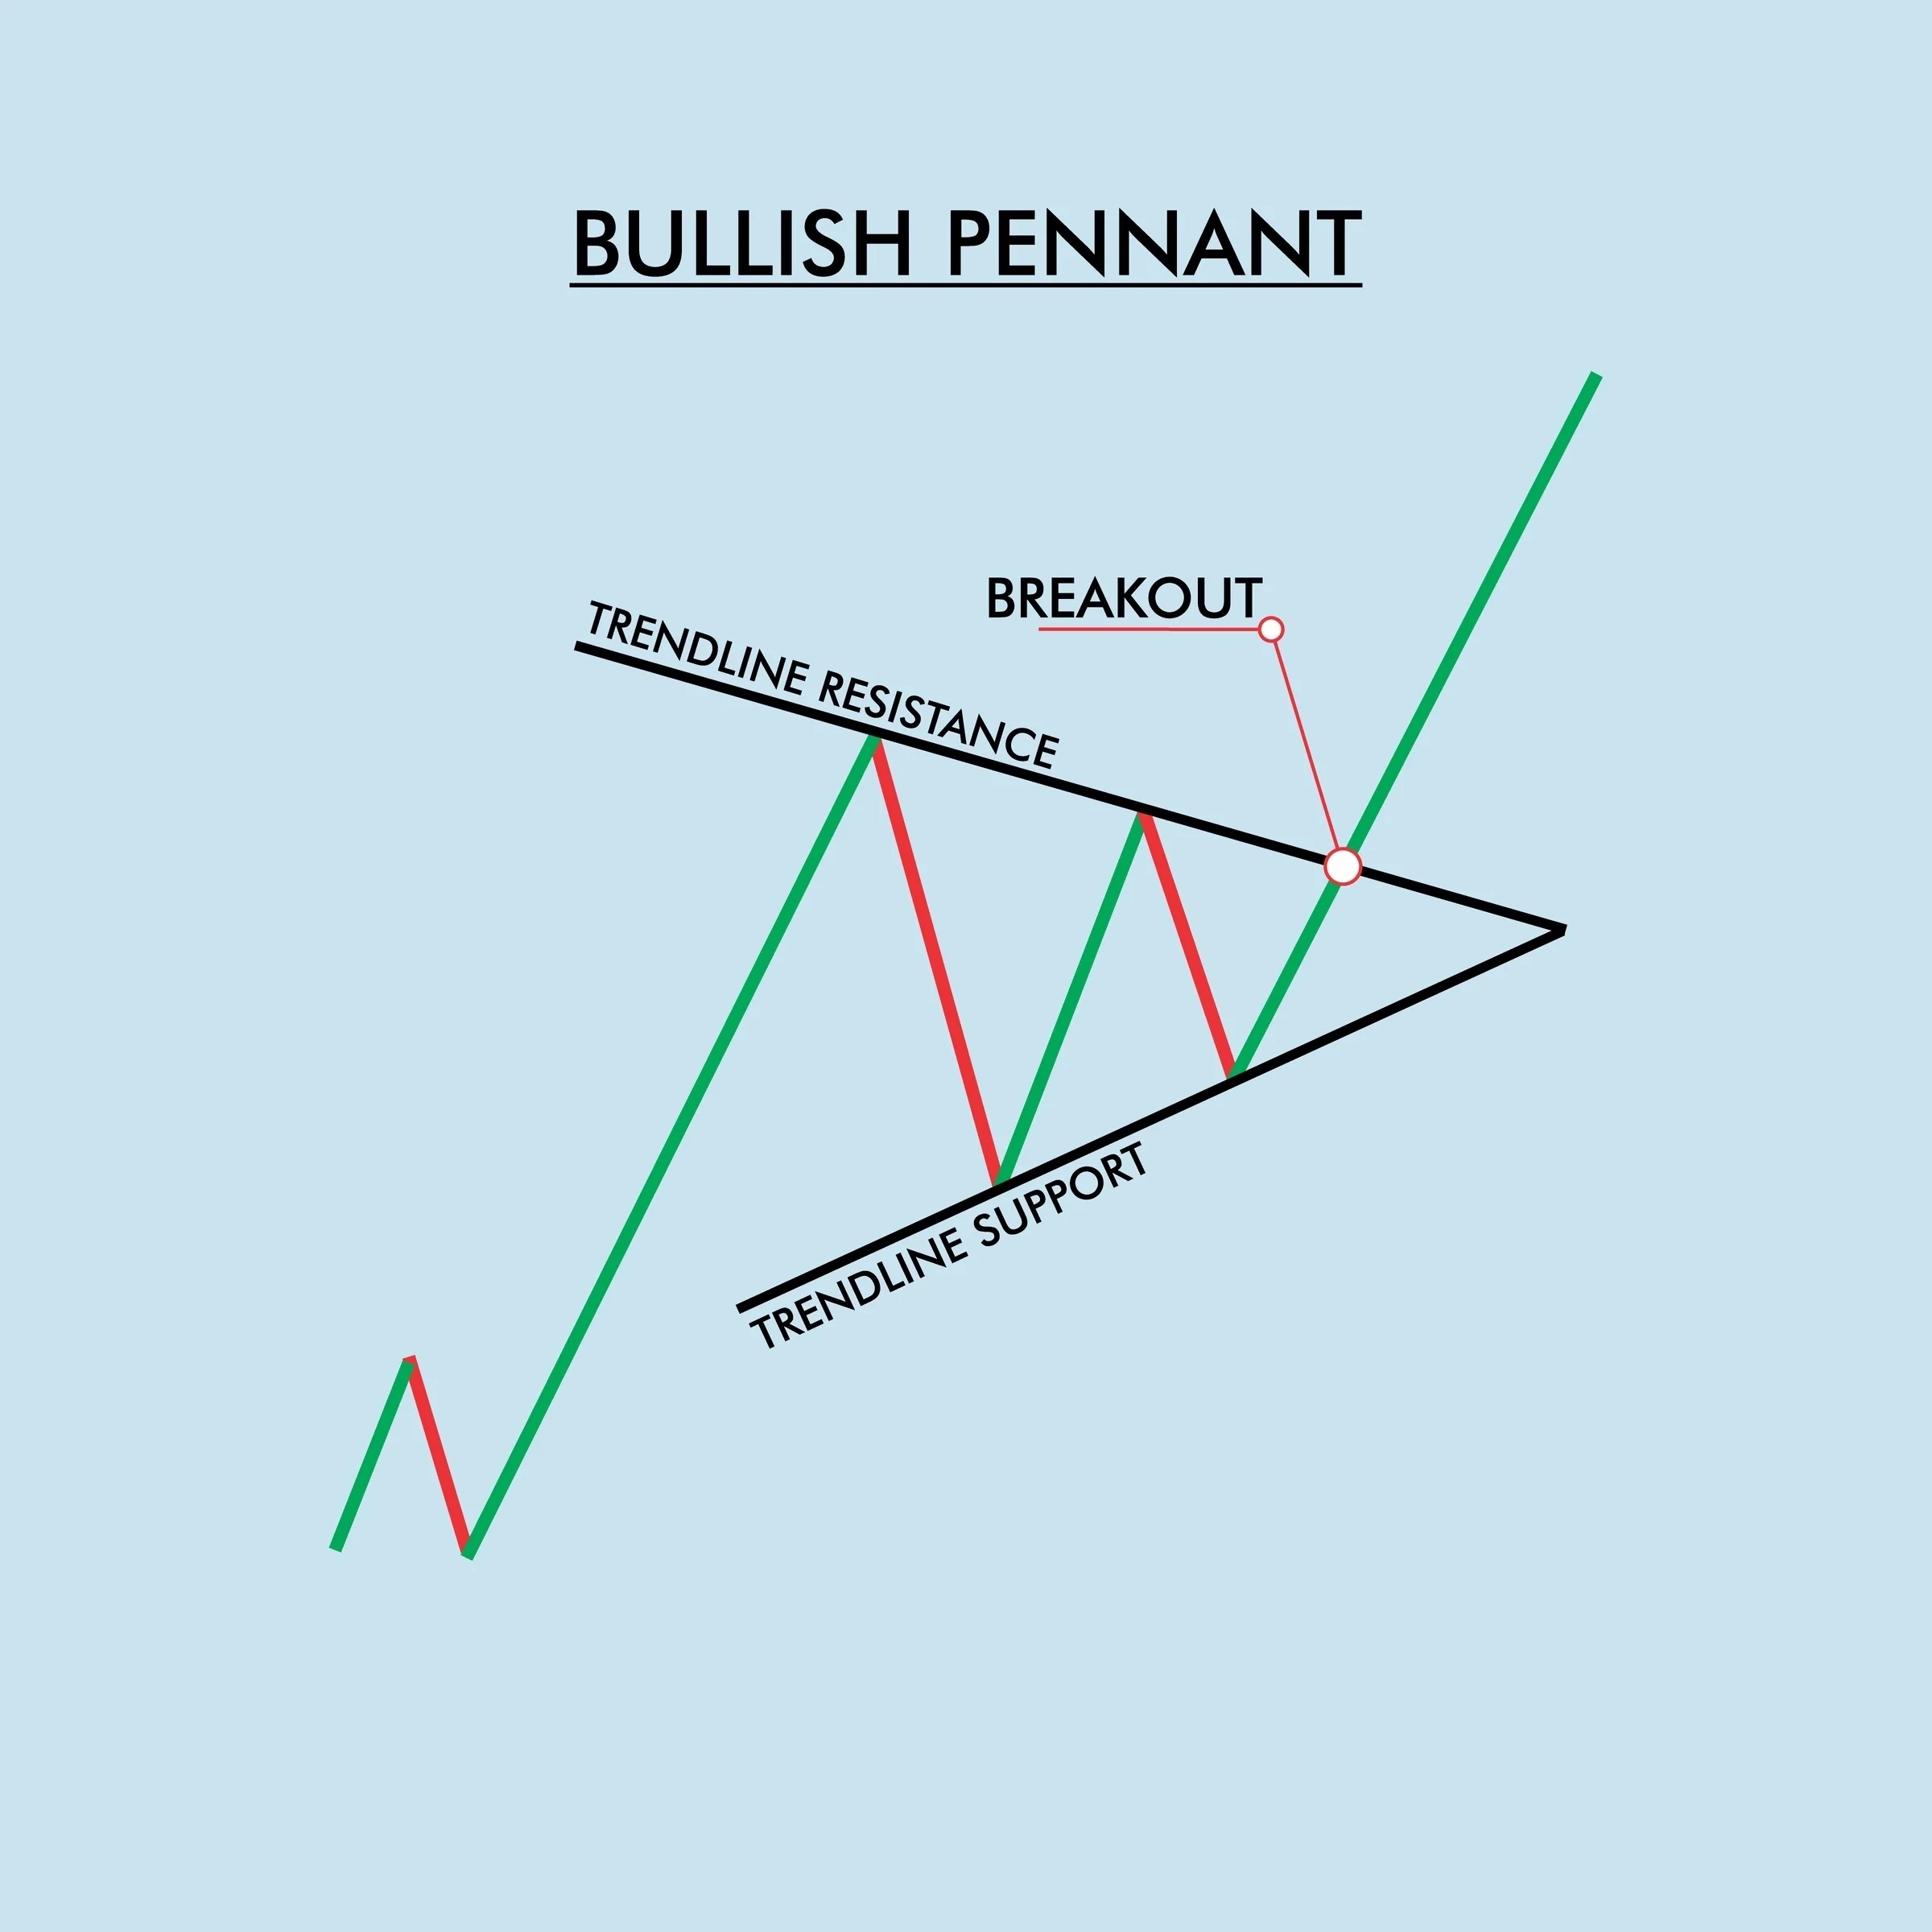
What it looks like: After a massive, steep upward surge in price (the flagpole), the stock immediately consolidates into a tiny, tight symmetrical triangle (the pennant) over just a few days. The highs get slightly lower, and the lows get slightly higher, creating a rapid squeeze.
The Psychology in NEPSE: This pattern is driven by pure urgency and FOMO (Fear Of Missing Out). After the initial surge, a few early buyers take quick profits, but sidelined investors are so desperate to get in that they aggressively buy every tiny micro-dip. This creates a high-pressure squeeze. The buyers and sellers are deadlocked in a rapidly shrinking space until the sellers run out of shares, and the buying pressure explodes upward.
Your Next Move: Because this pattern happens fast, do not buy while the stock is still trapped inside the tiny triangle. Wait for a daily candle to confidently close above the upper downward-sloping trendline with a massive surge in volume to catch the next explosive move.
➡️ Learn how to trade the high-speed Bullish Pennant squeeze here.
8. The Ascending Triangle: Breaking the Ceiling
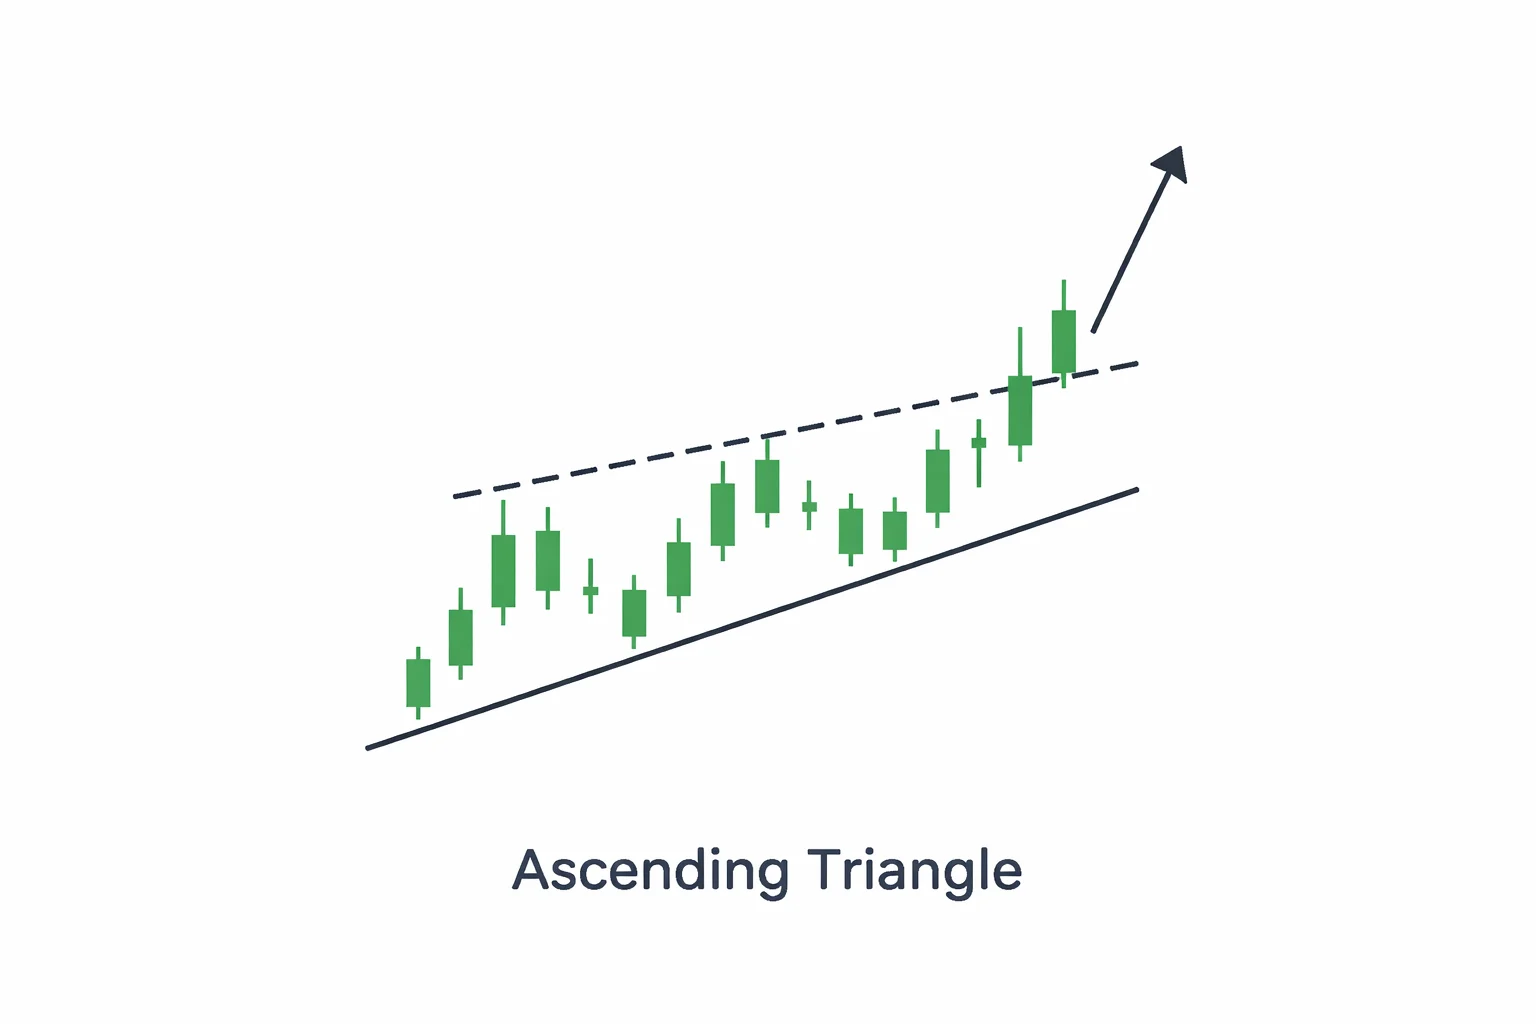
What it looks like: The stock keeps hitting a flat, horizontal price ceiling (resistance) but the pullbacks are getting shallower, creating an upward-sloping floor of higher lows (support). The price gets squeezed into a right-angled triangle pointing upward.
The Psychology in NEPSE: This pattern reveals a clear battle where the buyers are mathematically primed to win. Sellers are stubbornly defending a specific price, dumping their shares every time it hits that ceiling. However, aggressive buyers are stepping in earlier and earlier on every dip because they believe the stock is valuable. Eventually, the sellers simply run out of shares to sell, the supply wall collapses, and the buyers break through the ceiling.
Your Next Move: Patience is key. Do not buy while the stock is still trapped inside the triangle, as it could face a rare downside rejection. Wait for a daily candle to close cleanly above the flat resistance line with a noticeable spike in volume before buying.
➡️ Master the Ascending Triangle and learn how to trade the breakout safely here.
Final Thoughts: Trading the NEPSE with Confidence
Learning these bullish chart patterns gives you a massive edge in the Nepal Stock Exchange (NEPSE). But remember, chart patterns are not magic crystal balls—they are simply the visual footprints of human emotion. They show us exactly where fear, greed, and institutional "smart money" are clashing on the chart.
As a smart laganikarta, your job isn't to predict the future; your job is to react to confirmed signals. Keep these three golden rules in mind before you hit the "Buy" button:
Never anticipate: Always wait for a daily candle to confidently break the resistance line before entering.
Volume is your lie detector: A bullish breakout without a massive spike in daily turnover is likely a trap.
Always use a Stop-Loss: No pattern is 100% accurate. Always protect your capital just in case the setup fails.
🎯 What should you do next?
Now that you know how to spot the start of a massive bull run, you need to know exactly when to sell and protect your profits before the market crashes.
📉 Ready to master capital protection? Read our next major guide: Bearish Chart Patterns in NEPSE: Top Signals to Protect Your Capital.
📊 Practice makes perfect: Open up charting tools right now. Pick 3 of your favorite scrips and try to find at least one historical Bull Flag or Double Bottom.
📩 Never miss a setup: Subscribe to our free weekly newsletter to get the latest NEPSE chart breakdowns and technical analysis tips delivered straight to your inbox! Newsletter Signup