
In the Nepal Stock Exchange (NEPSE), watching a stock steadily grind downward can be painful. But for a trained laganikarta, not all downtrends are a reason to panic. Sometimes, a falling stock is actually preparing for a massive bullish explosion.
When a stock is making lower highs and lower lows, but the downward momentum is clearly shrinking, it forms a Falling Wedge. This is one of the most powerful and reliable bullish patterns (acting as either a reversal or a continuation) because it visually shows you the exact moment the sellers are running out of steam.
Anatomy of the Falling Wedge
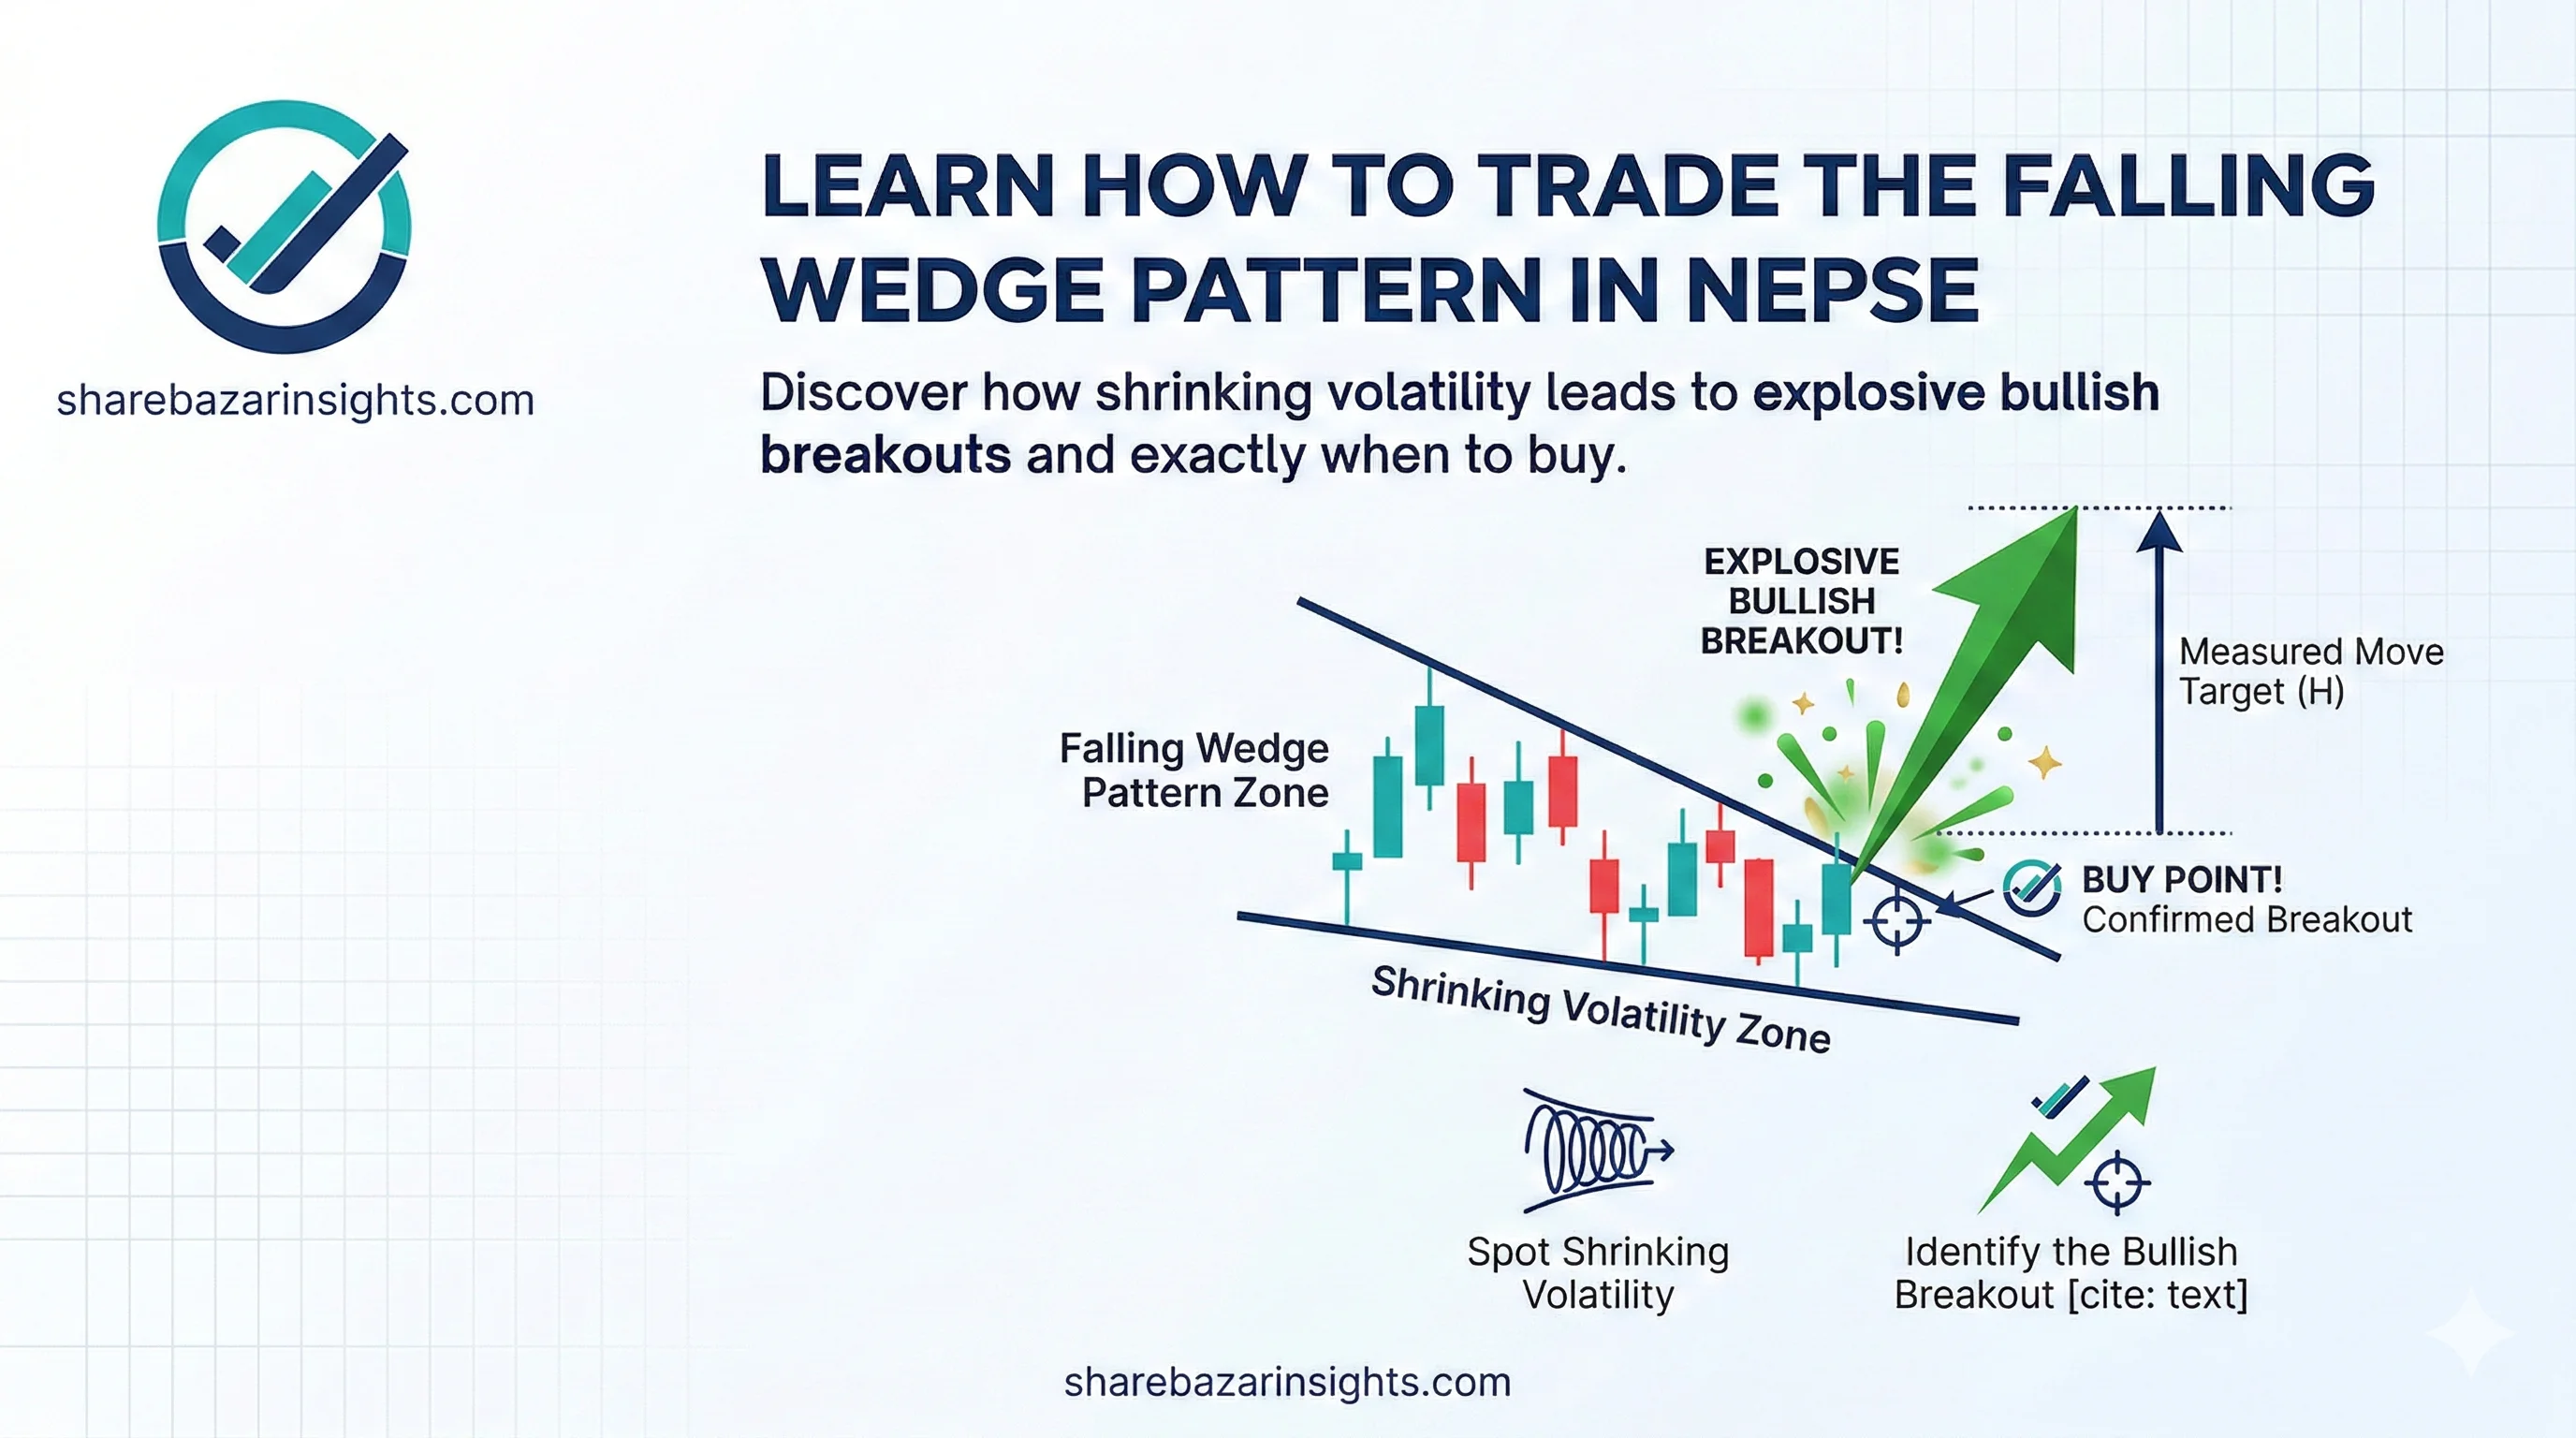
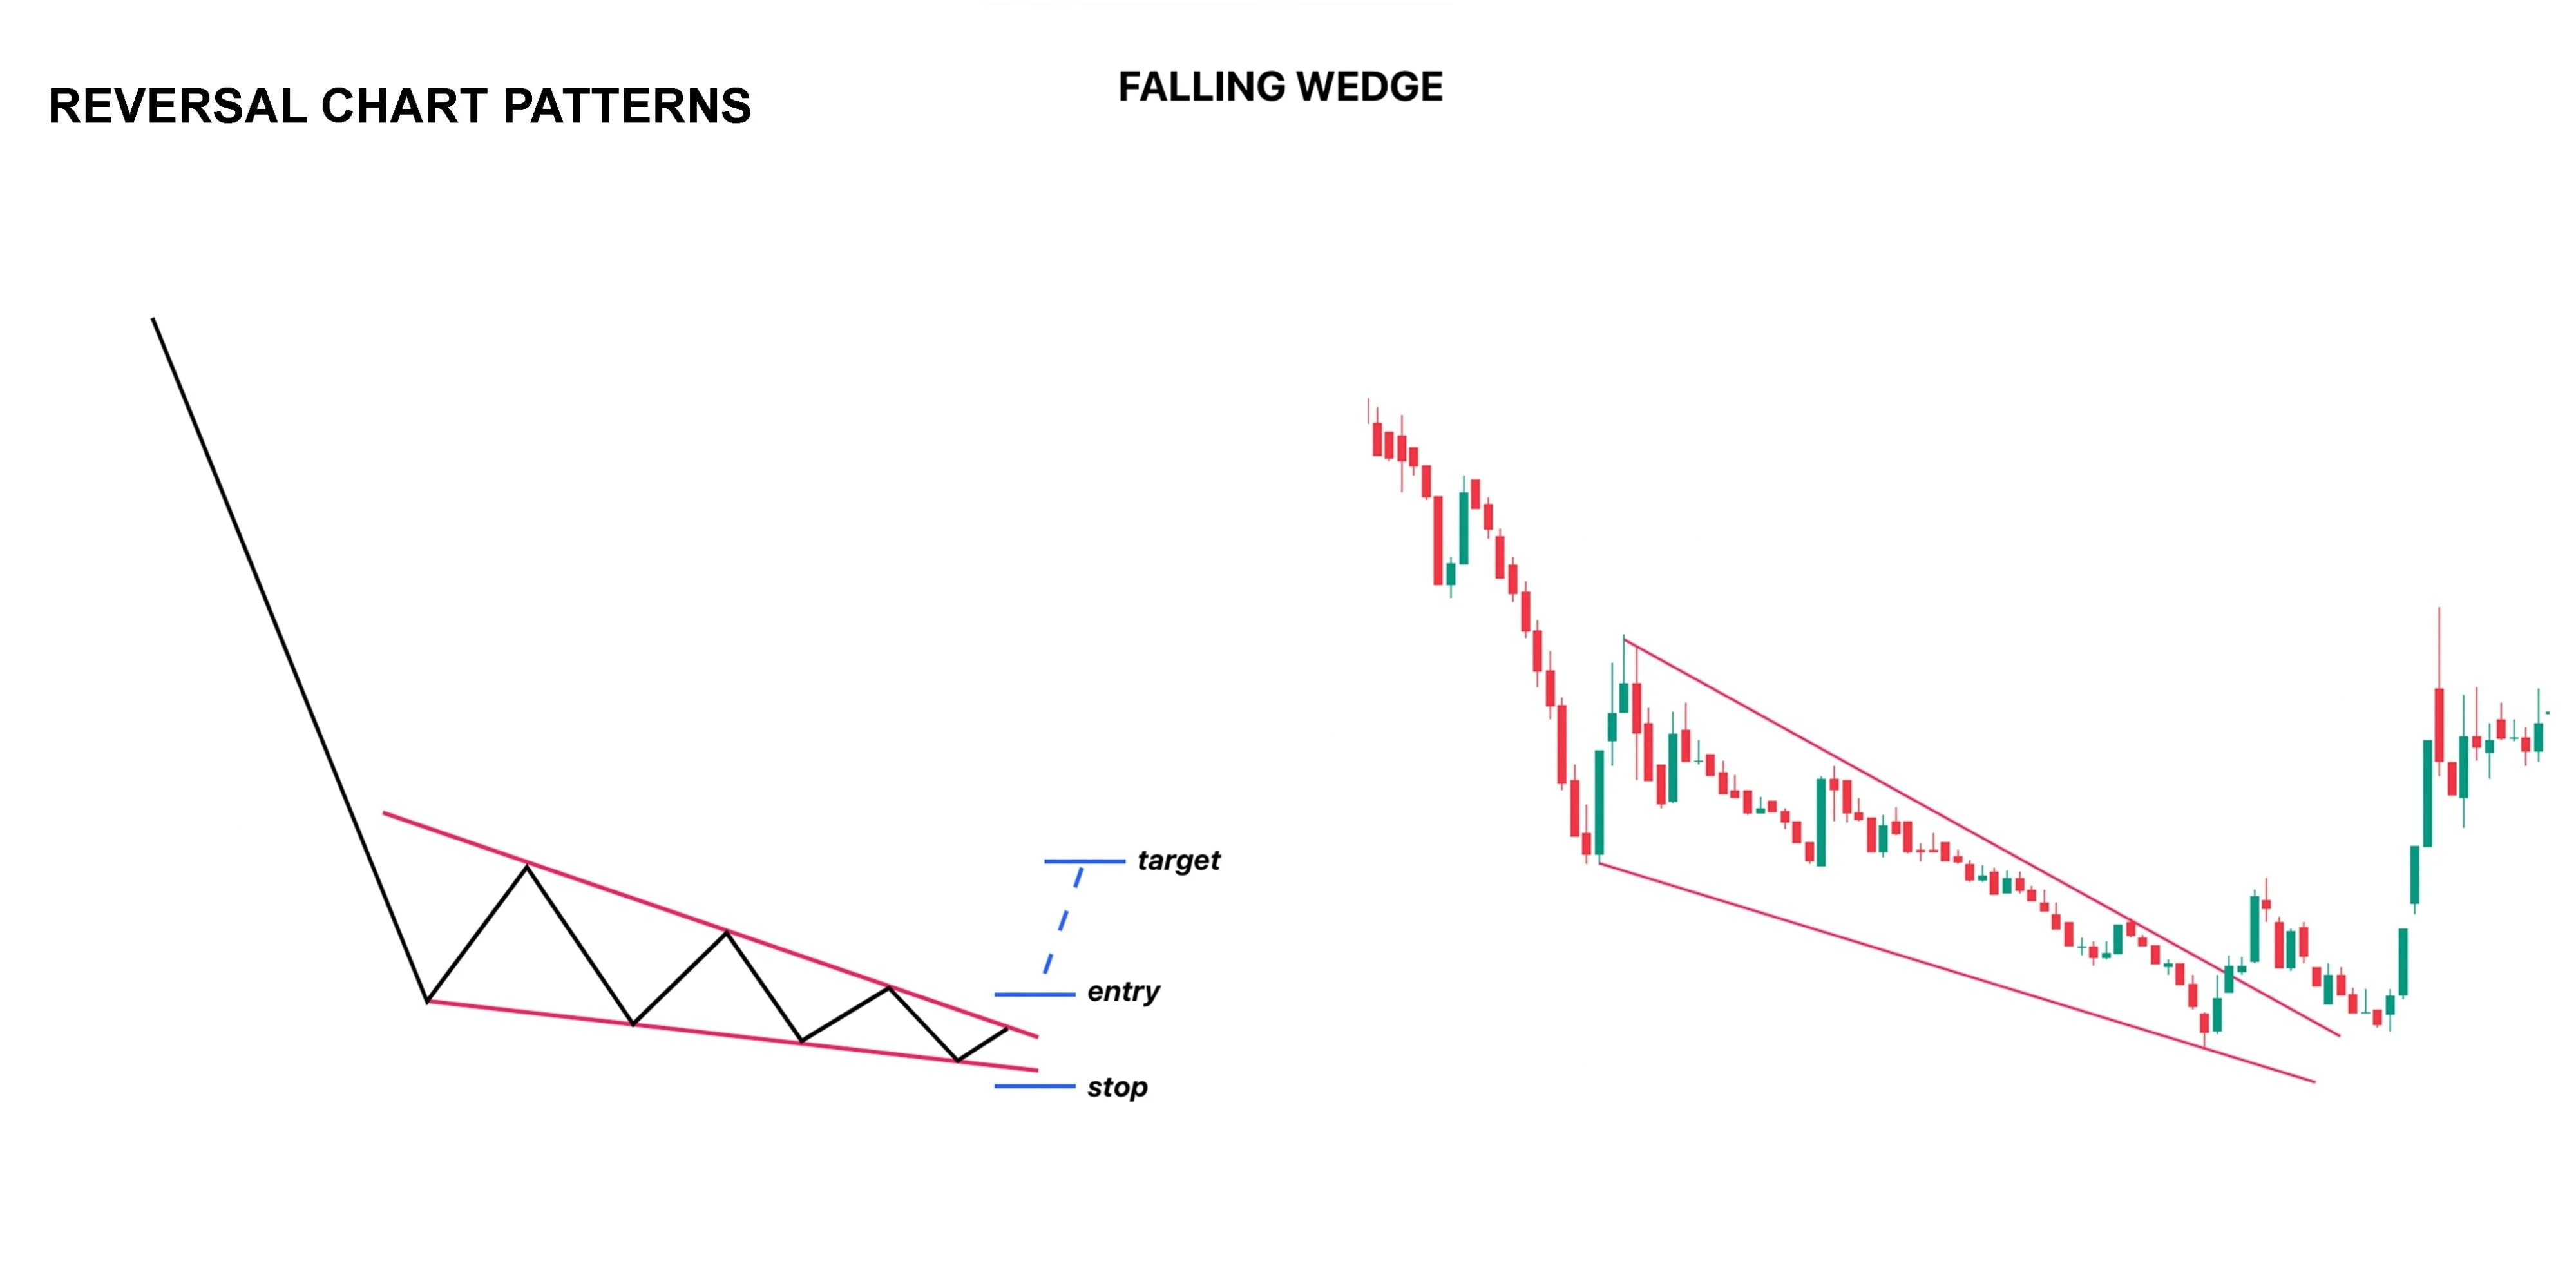
Unlike a parallel downward channel where the price bounces evenly, a Falling Wedge is all about compression. It consists of two downward-sloping trendlines that are converging (squeezing together):
📉 The Steep Ceiling (Resistance): The upper trendline connects a series of lower highs. Sellers are still pushing the price down, causing a steep drop.
📉 The Shallow Floor (Support): The lower trendline connects a series of lower lows. Crucially, this line is flatter (less steep) than the ceiling. The stock is dropping, but the drops are getting smaller and smaller.
🗜️ The Squeeze: The price gets trapped in a shrinking, downward-pointing cone.
🚀 The Breakout: The sellers are completely exhausted, and the price forcefully breaks upward through the resistance ceiling.
The Psychology: The Sellers' Trap
The Falling Wedge is a beautiful illustration of seller exhaustion.
Because the stock is technically still making lower lows, amateur investors get scared and continue to sell their shares at cheaper and cheaper prices. However, the smart money notices that the drops are losing their depth. The flatter lower trendline proves that buyers are starting to quietly step in and absorb the selling pressure.
The sellers are spending all their energy just to push the stock a few rupees lower. The spring is winding tighter and tighter. Eventually, the sellers run completely out of shares. The moment the selling pressure vanishes, the trapped buyers take absolute control, and the stock forcefully breaks upward, leaving the panicked sellers behind.
How to Trade It Safely in NEPSE
Because the stock is technically still falling while inside the wedge, patience is your best friend:
🚦 The Entry Point: Do not try to catch the falling knife by buying at the bottom support line. The absolute safest buy signal is when a daily candlestick decisively closes above the upper downward-sloping resistance line.
📊 The Volume Clue: As the wedge squeezes tighter, trading turnover should noticeably dry up—this proves the sellers are running out of shares. A true bullish breakout must be accompanied by a massive spike in daily volume.
🛡️ The Stop Loss: Once you enter the breakout, place your strict stop loss just below the last "lower low" inside the wedge.
🎯 The Target: Measure the height of the thickest part of the wedge (at the very beginning of the pattern). Add that measurement to your breakout price to set your primary profit target.
🎯 Next Move for Laganikartas: Scan your NEPSE charts for stocks that have been dropping but are starting to slow down. Draw your trendlines. If the lines are pointing down but squeezing together, set a price alert at the upper resistance line and prepare to catch the breakout! ➡️ Falling Wedge vs. Descending Triangle: Learn how to tell the difference to avoid a bearish trap here.