
In the Nepal Stock Exchange (NEPSE), trying to guess exactly when a bear market has ended is a dangerous game. Many laganikartas get burned trying to "catch a falling knife" by buying a stock that is still actively crashing.
However, if you know what to look for, the market will actually show you exactly when the sellers have surrendered. One of the most famous, reliable, and powerful bullish reversal signals in technical analysis is the Inverse Head and Shoulders pattern. When this forms at the bottom of a heavy downtrend, it is your ultimate green light that a new bull run is about to begin.
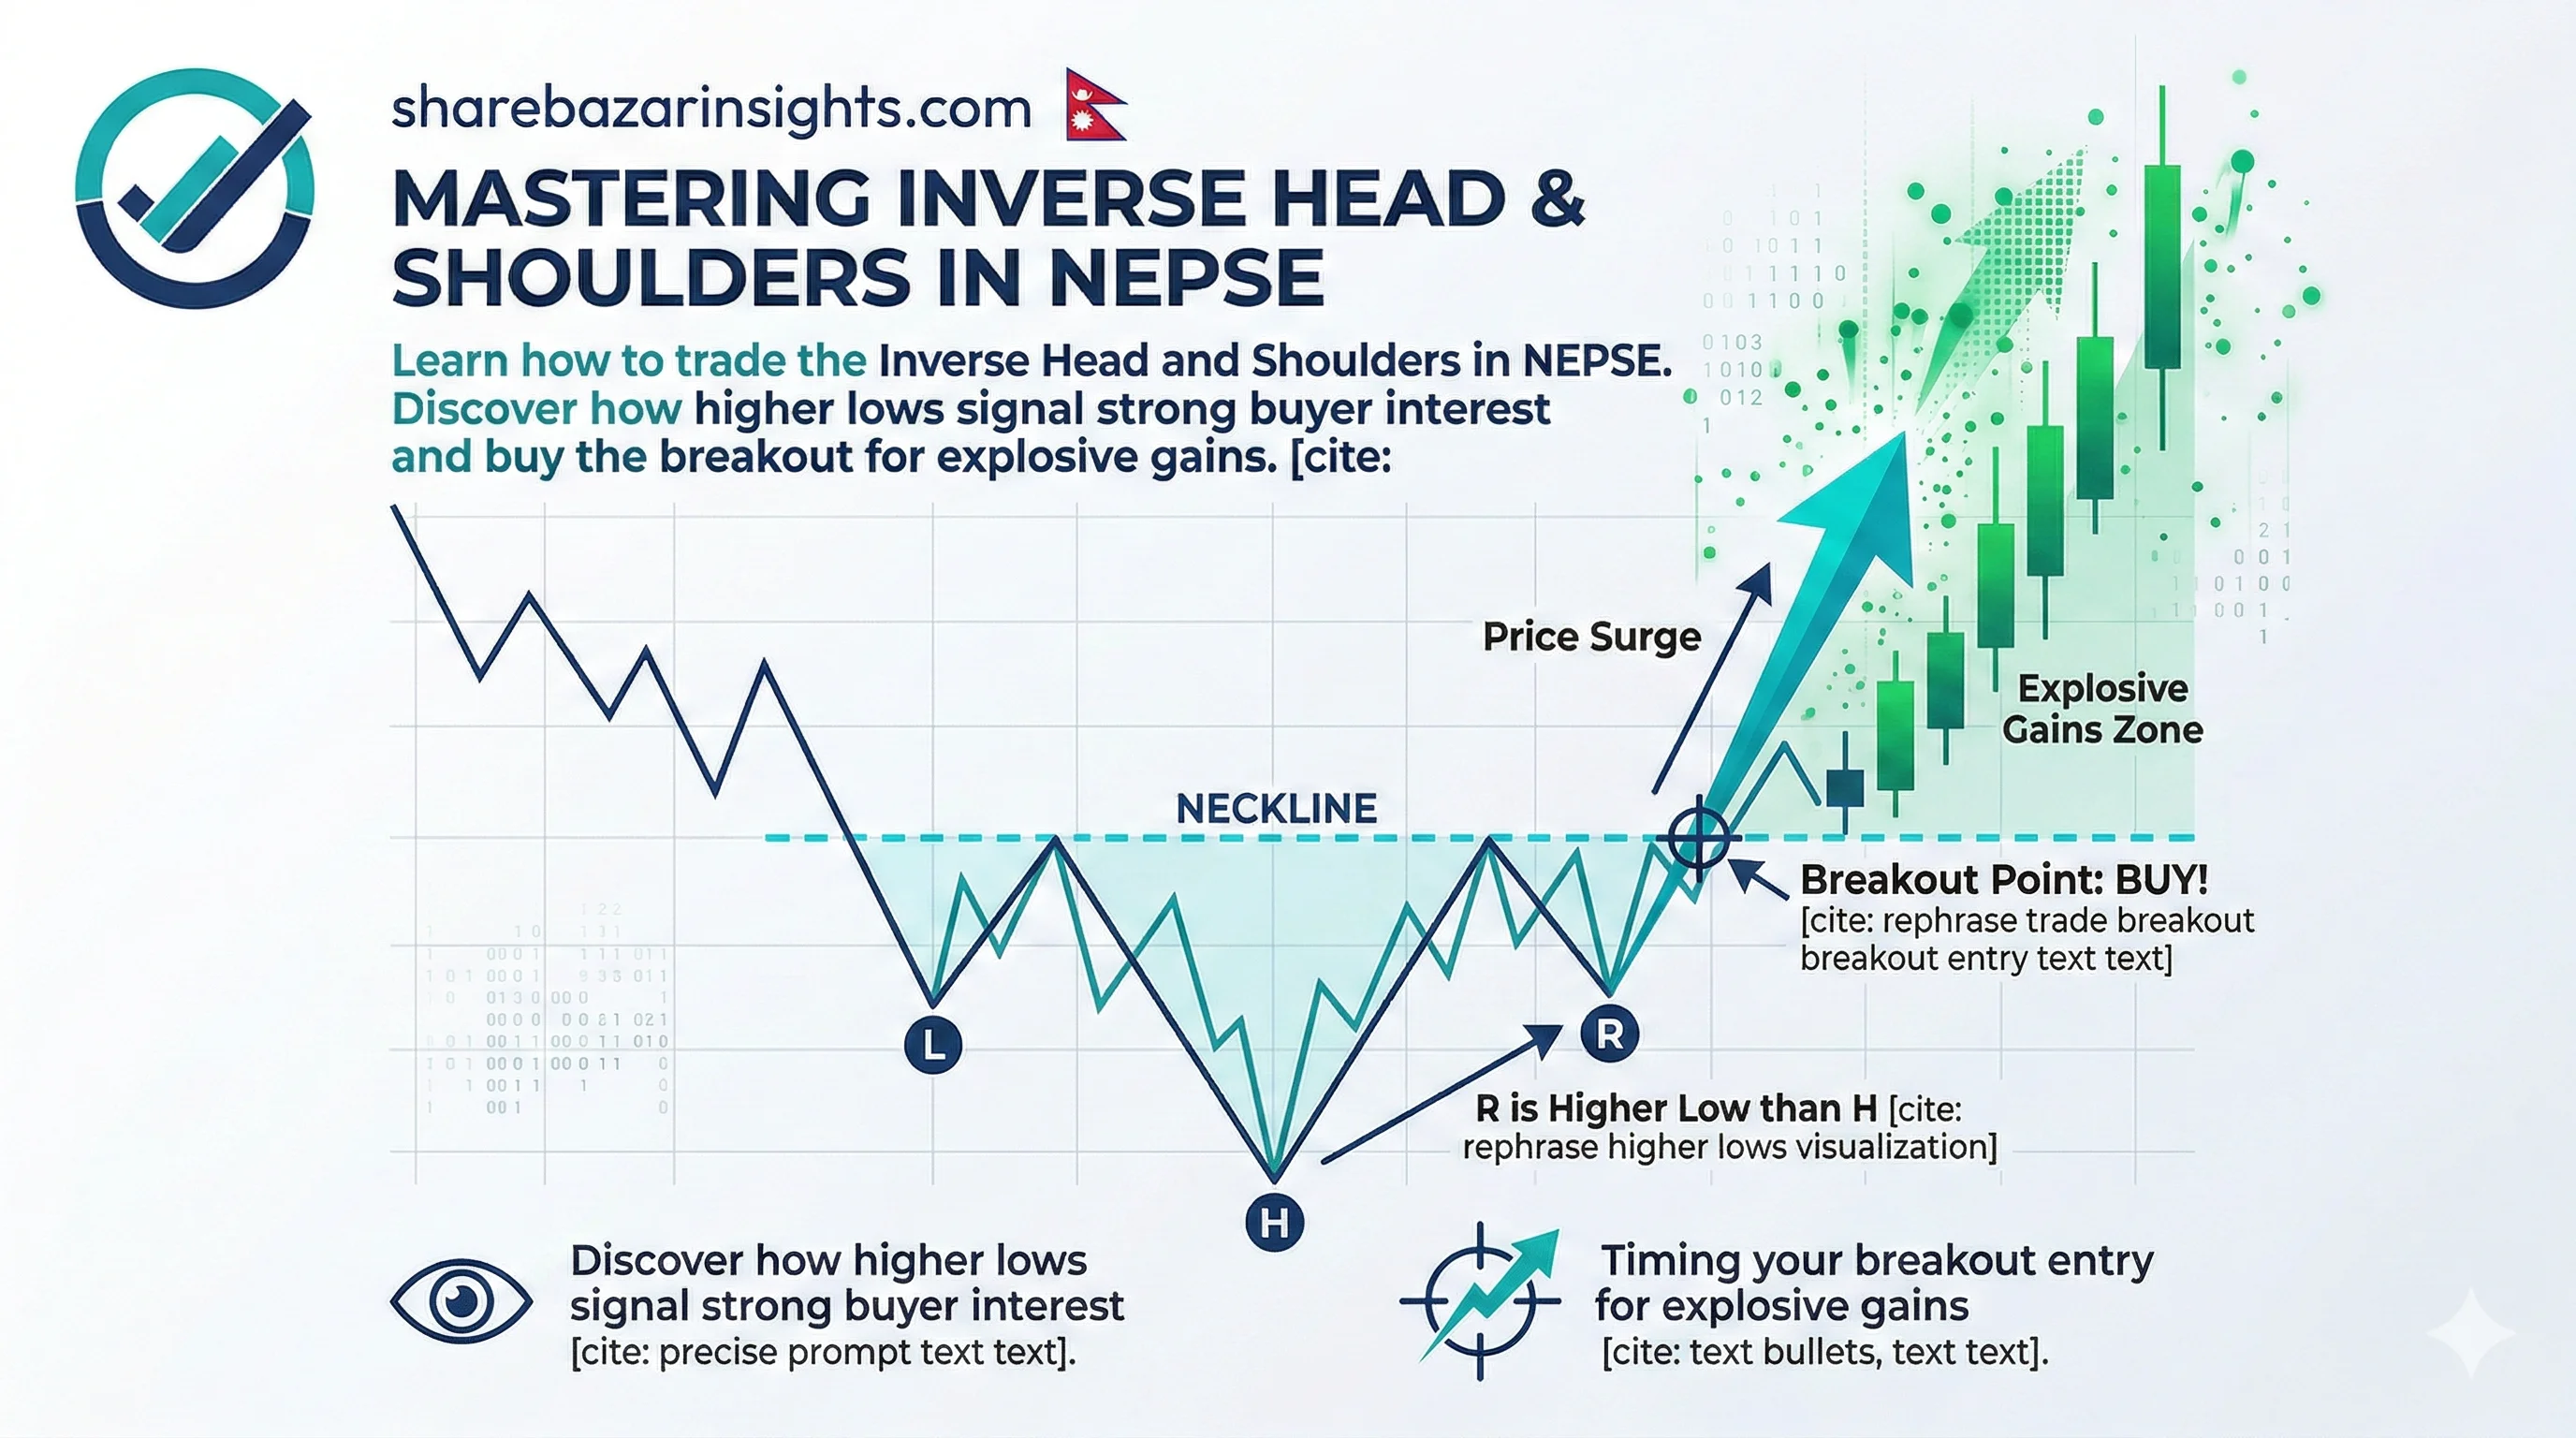
Anatomy of the Inverse Head and Shoulders
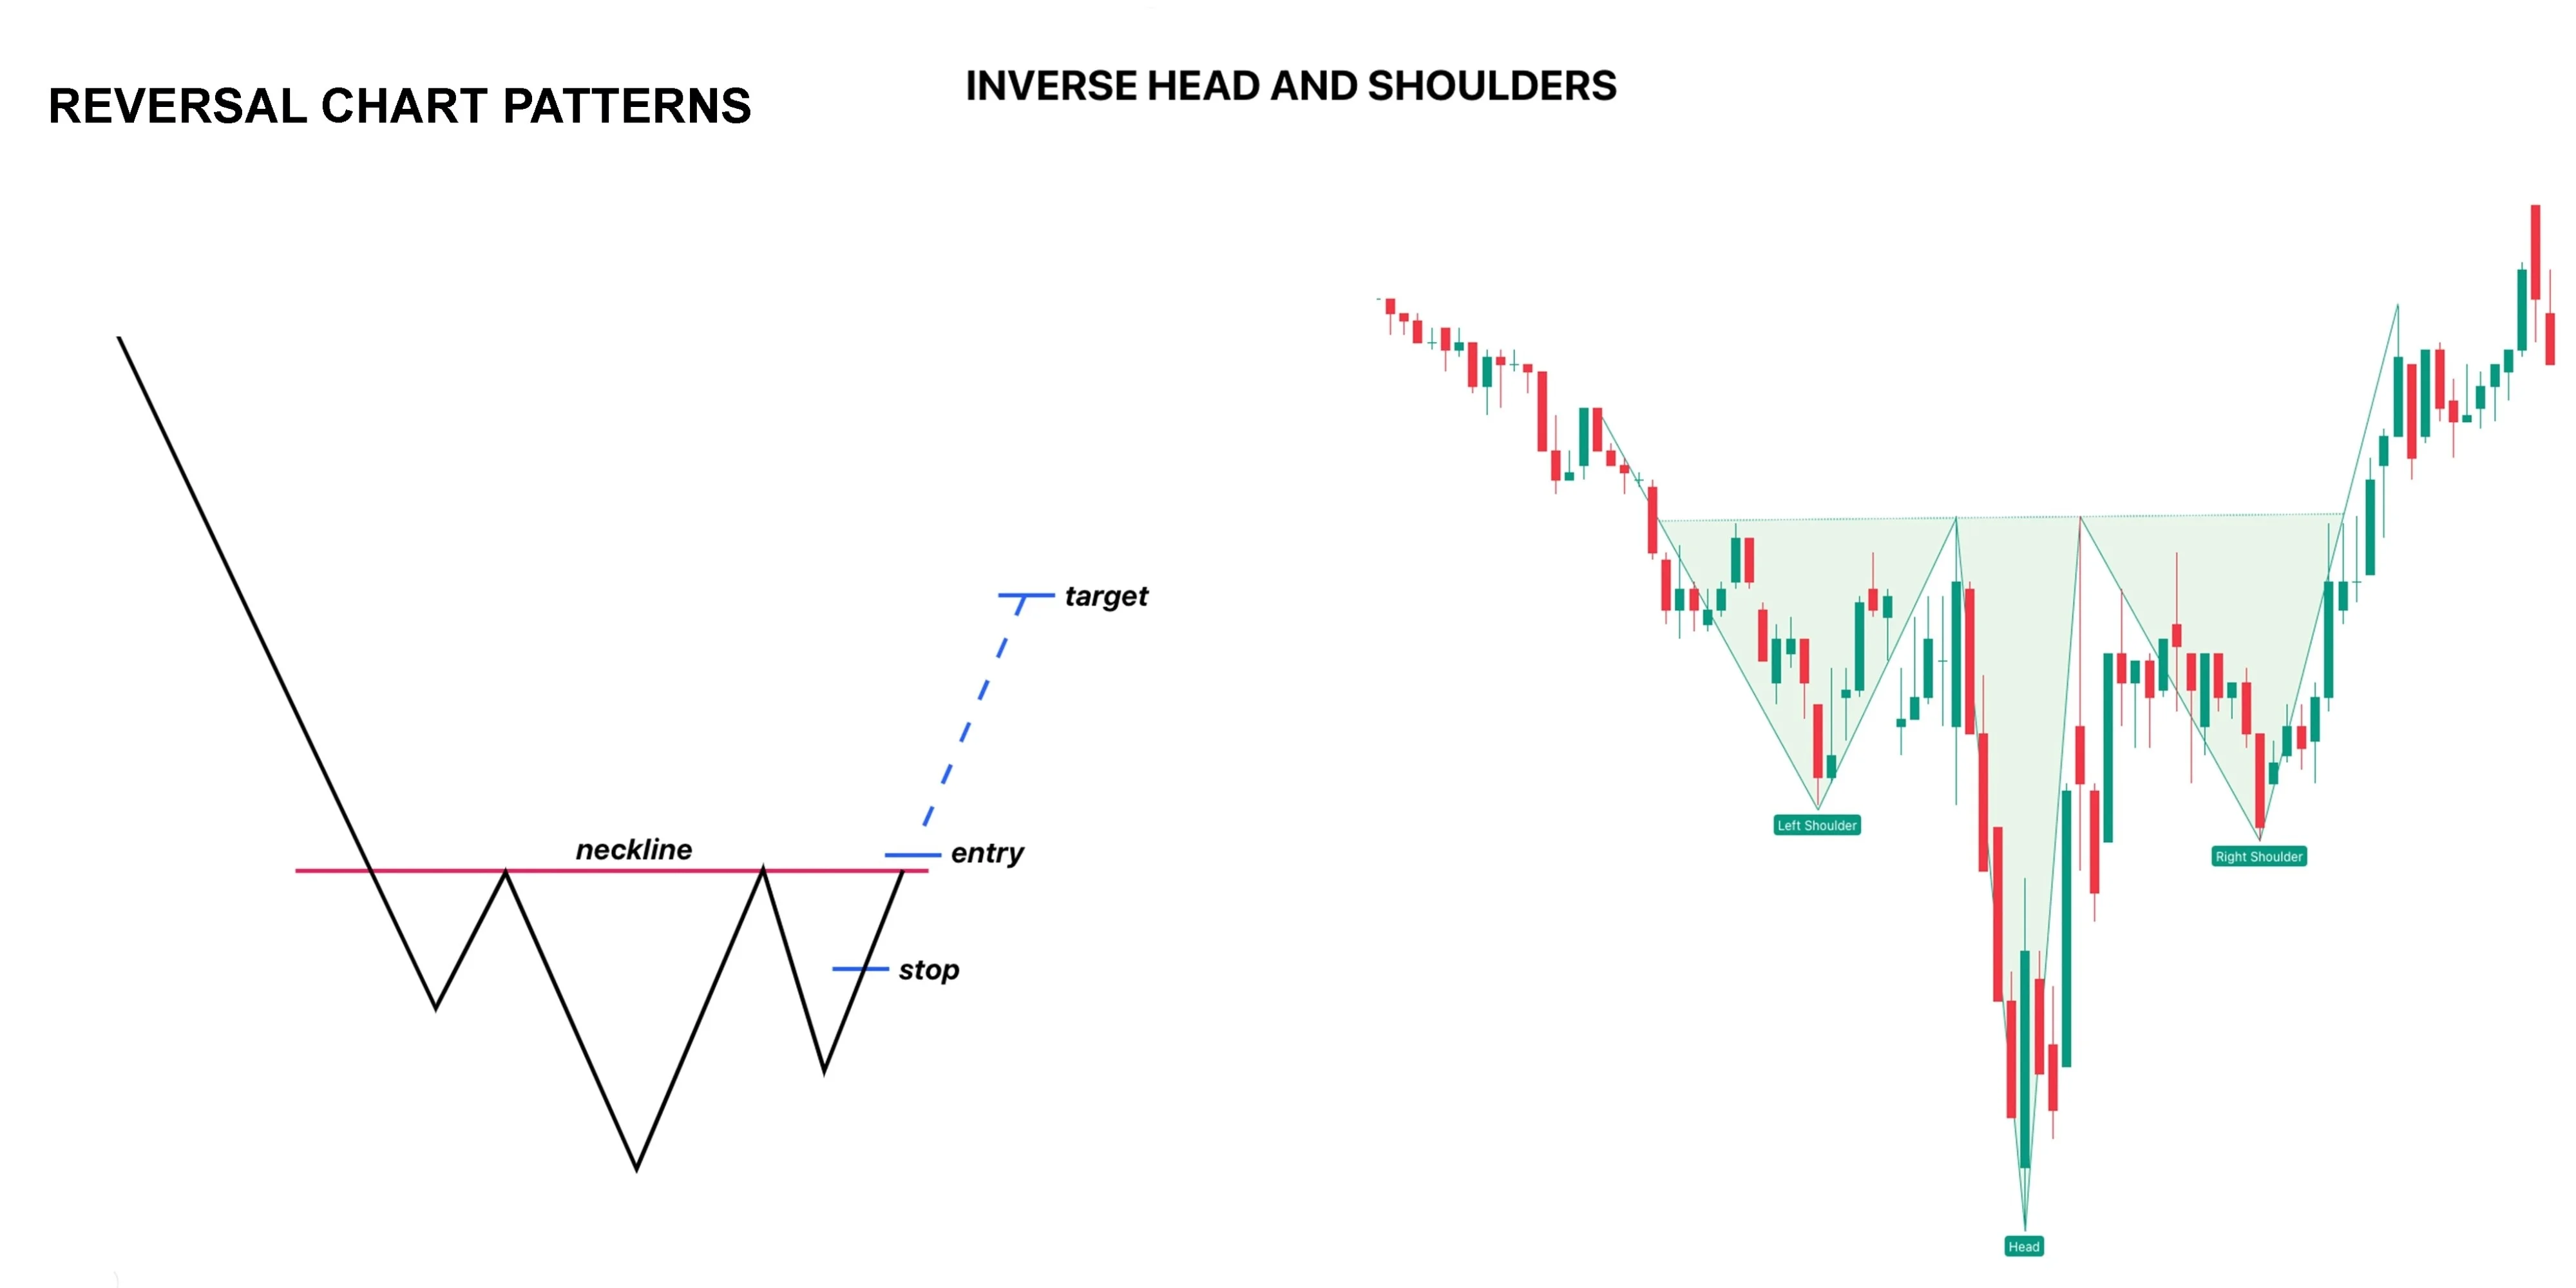
This pattern is the exact opposite of the standard bearish Head and Shoulders. It forms at the bottom of a downtrend and consists of three distinct valleys (troughs):
The Left Shoulder: The stock is in a heavy downtrend. It crashes to a new low, bounces up naturally due to profit-taking, and establishes a resistance level called the "neckline."
The Head: The sellers regroup and push the price aggressively past the Left Shoulder to create an even deeper, massive new low (the Head). However, buyers rush in at this deeply discounted price, forcing the stock all the way back up to the neckline.
The Right Shoulder: The sellers make one final, desperate attempt to crash the price. Crucially, they fail to push it down to the level of the Head. The price forms a higher low (the Right Shoulder) and rallies back to the neckline.
The Psychology: The "Higher Low" of Hope
The secret to this pattern lies entirely in the Right Shoulder.
During a devastating NEPSE bear market, a stock is supposed to make lower highs and lower lows. The Left Shoulder and the Head follow this bearish rule perfectly. But the Right Shoulder breaks the rule. The fact that the sellers couldn't push the price back down to the deepest low proves they are completely out of ammunition.
Meanwhile, institutional buyers and smart money have realized the stock is undervalued. They aggressively step in during the Right Shoulder, absorbing whatever shares the panicked retail investors are selling. The momentum has officially shifted from fear to greed.
How to Trade It Safely in NEPSE
🚦 The Entry Signal: Do not buy just because you see a Right Shoulder forming! The pattern is not confirmed until a daily candlestick closes cleanly and decisively above the neckline. That breakout is your absolute signal to hit the buy button.
📊 The Volume Lie Detector: Volume is crucial here. You want to see heavy volume on the way down into the Head, but a noticeable dry-up in volume as the Right Shoulder forms. When the price finally breaks above the neckline, it must be accompanied by a massive spike in daily turnover to confirm the big players are buying.
🛡️ The Stop Loss: Once you buy the breakout, place your strict stop loss slightly below the bottom of the Right Shoulder. If the price falls below that point, the reversal has failed.
🎯 The Target: Measure the vertical distance from the deepest point of the Head straight up to the neckline. Add that exact distance to your breakout point to find your primary profit target.
🎯 Next Move for Laganikartas: Stop trying to buy the absolute bottom of a crash. Let the Head form, wait patiently for the Right Shoulder to prove the sellers are weak, and set your price alerts at the neckline resistance!