
In the Nepal Stock Exchange (NEPSE), investors often look for sharp, aggressive "V-shaped" bounces to make quick money. However, those sharp bounces are highly volatile and incredibly risky. For the patient laganikarta looking for a high-probability, low-risk entry, the Rounding Bottom (often called the "Saucer") is the ultimate setup.
This pattern is a slow, steady bullish reversal that signals a complete, long-term shift in market psychology. It shows exactly where the sellers slowly gave up, and the smart money quietly took over.
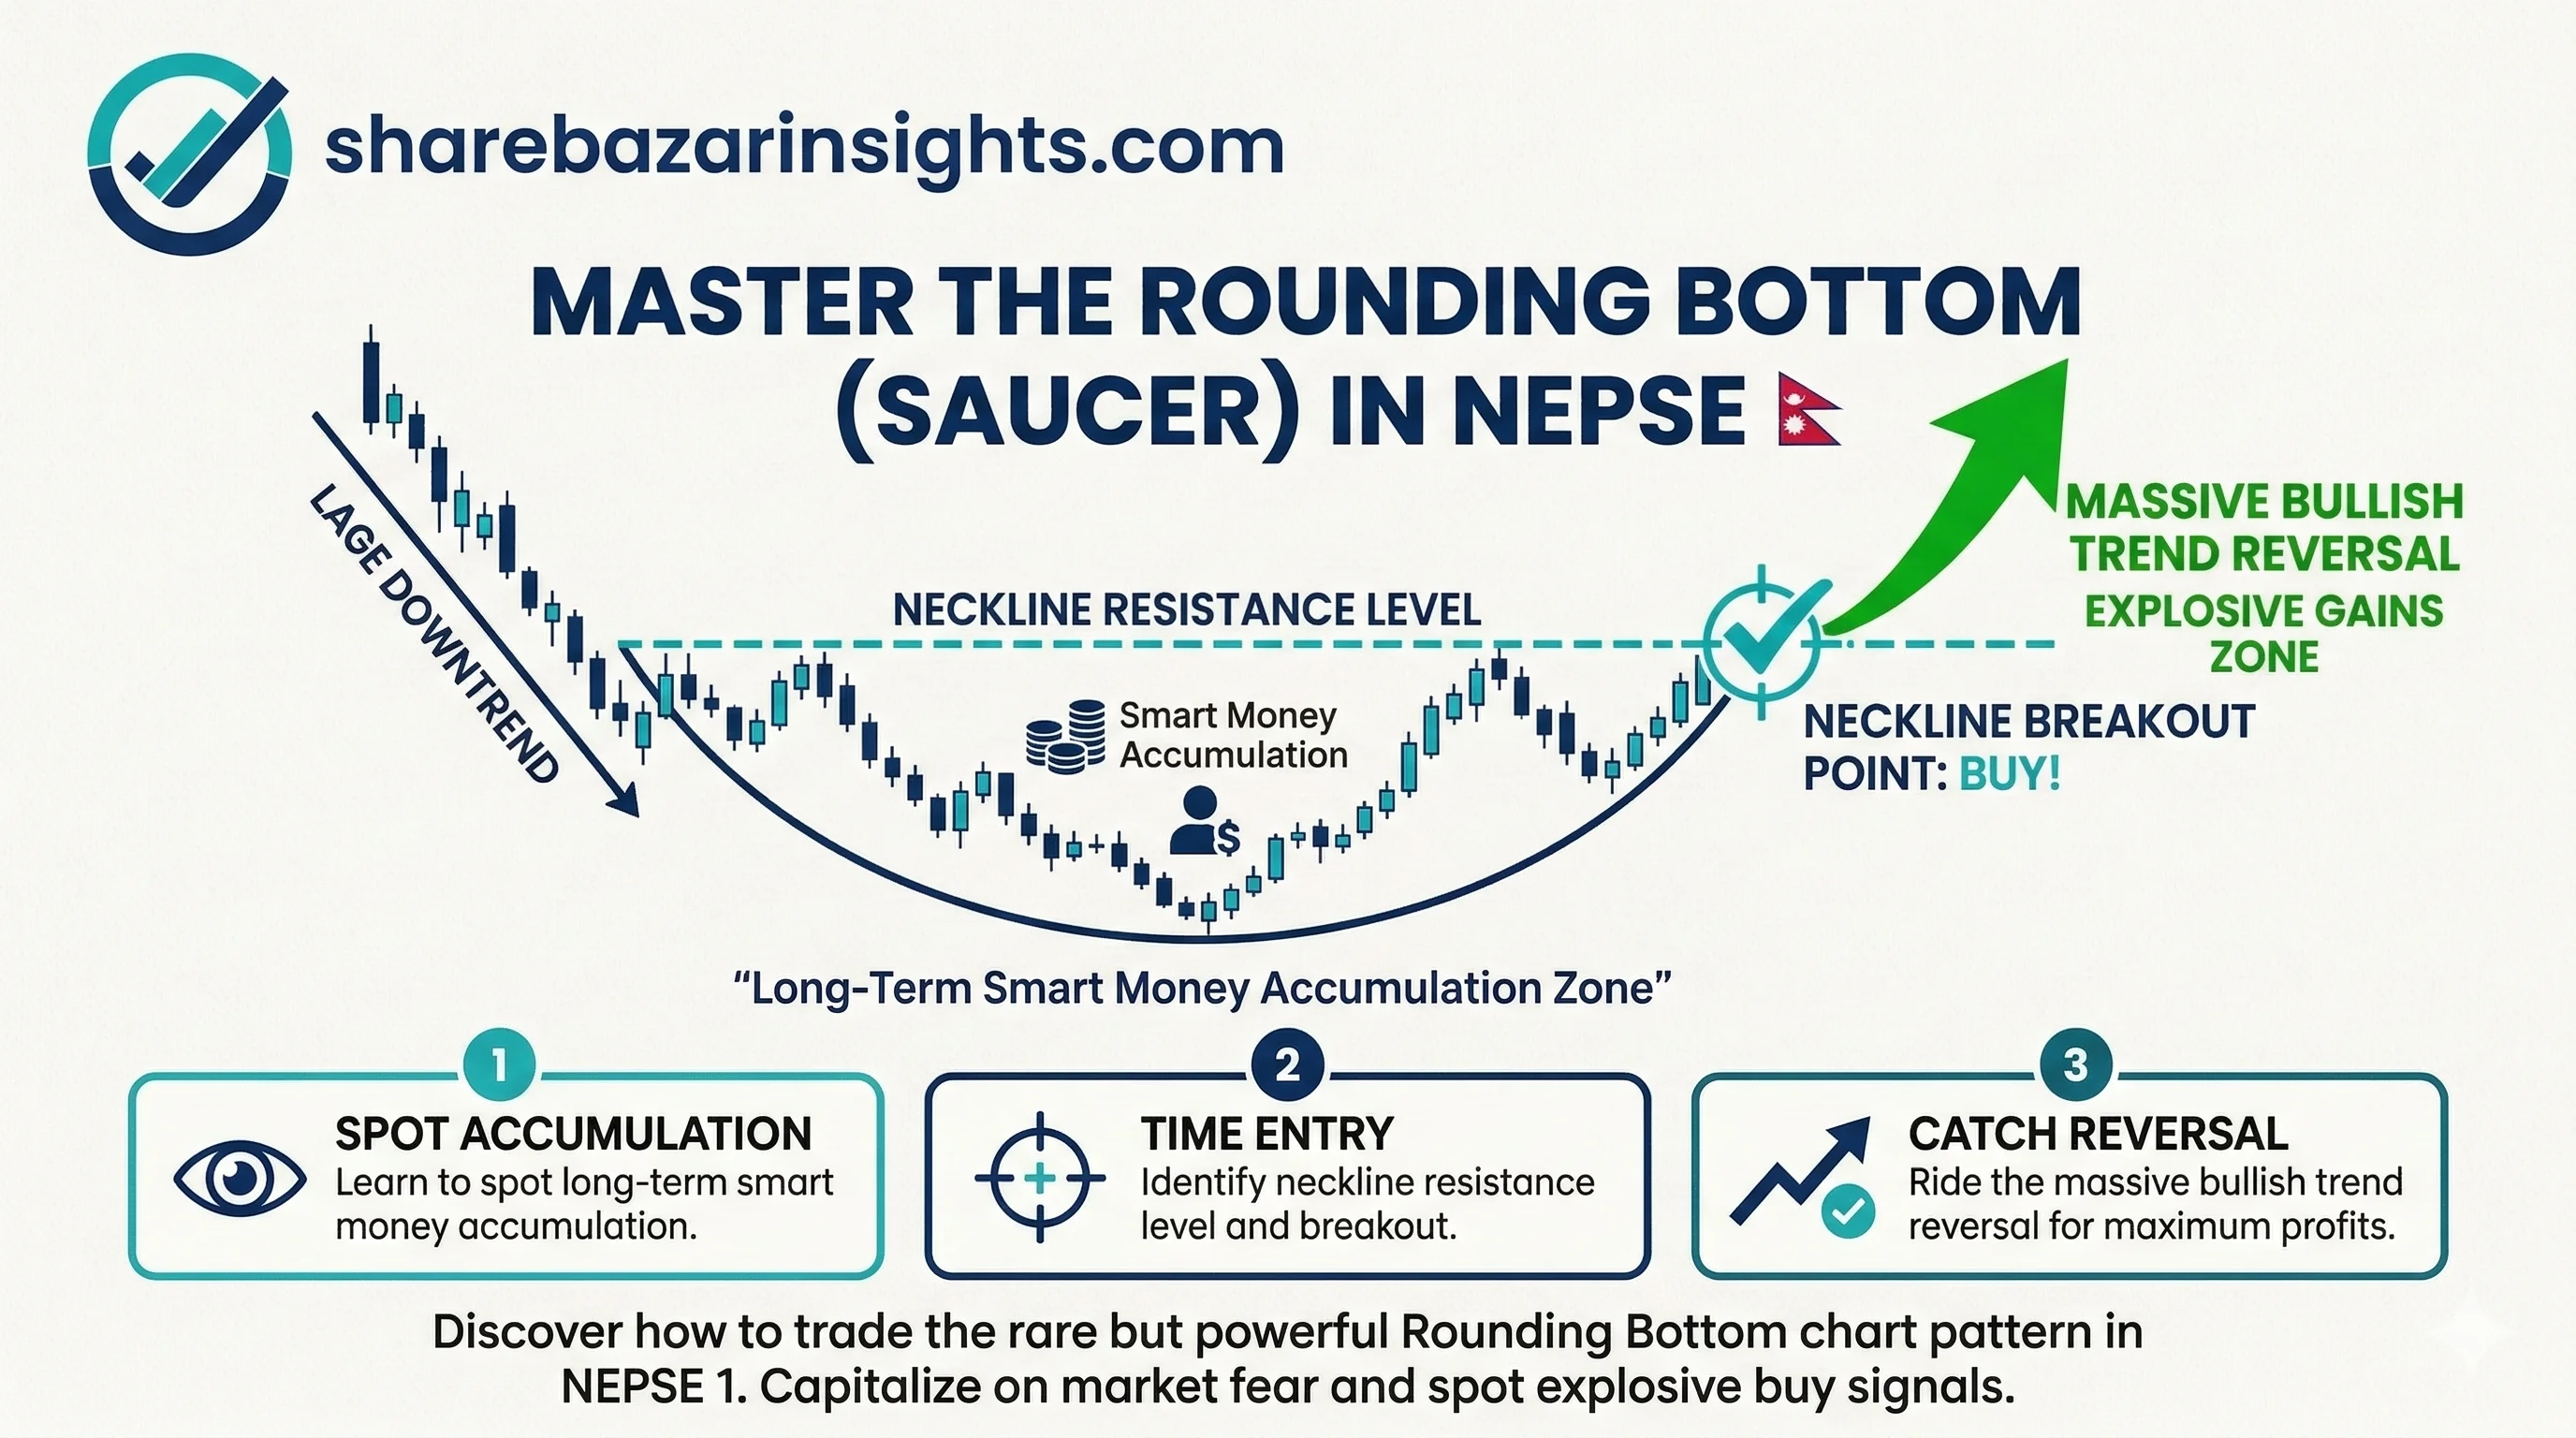
Anatomy of the Rounding Bottom
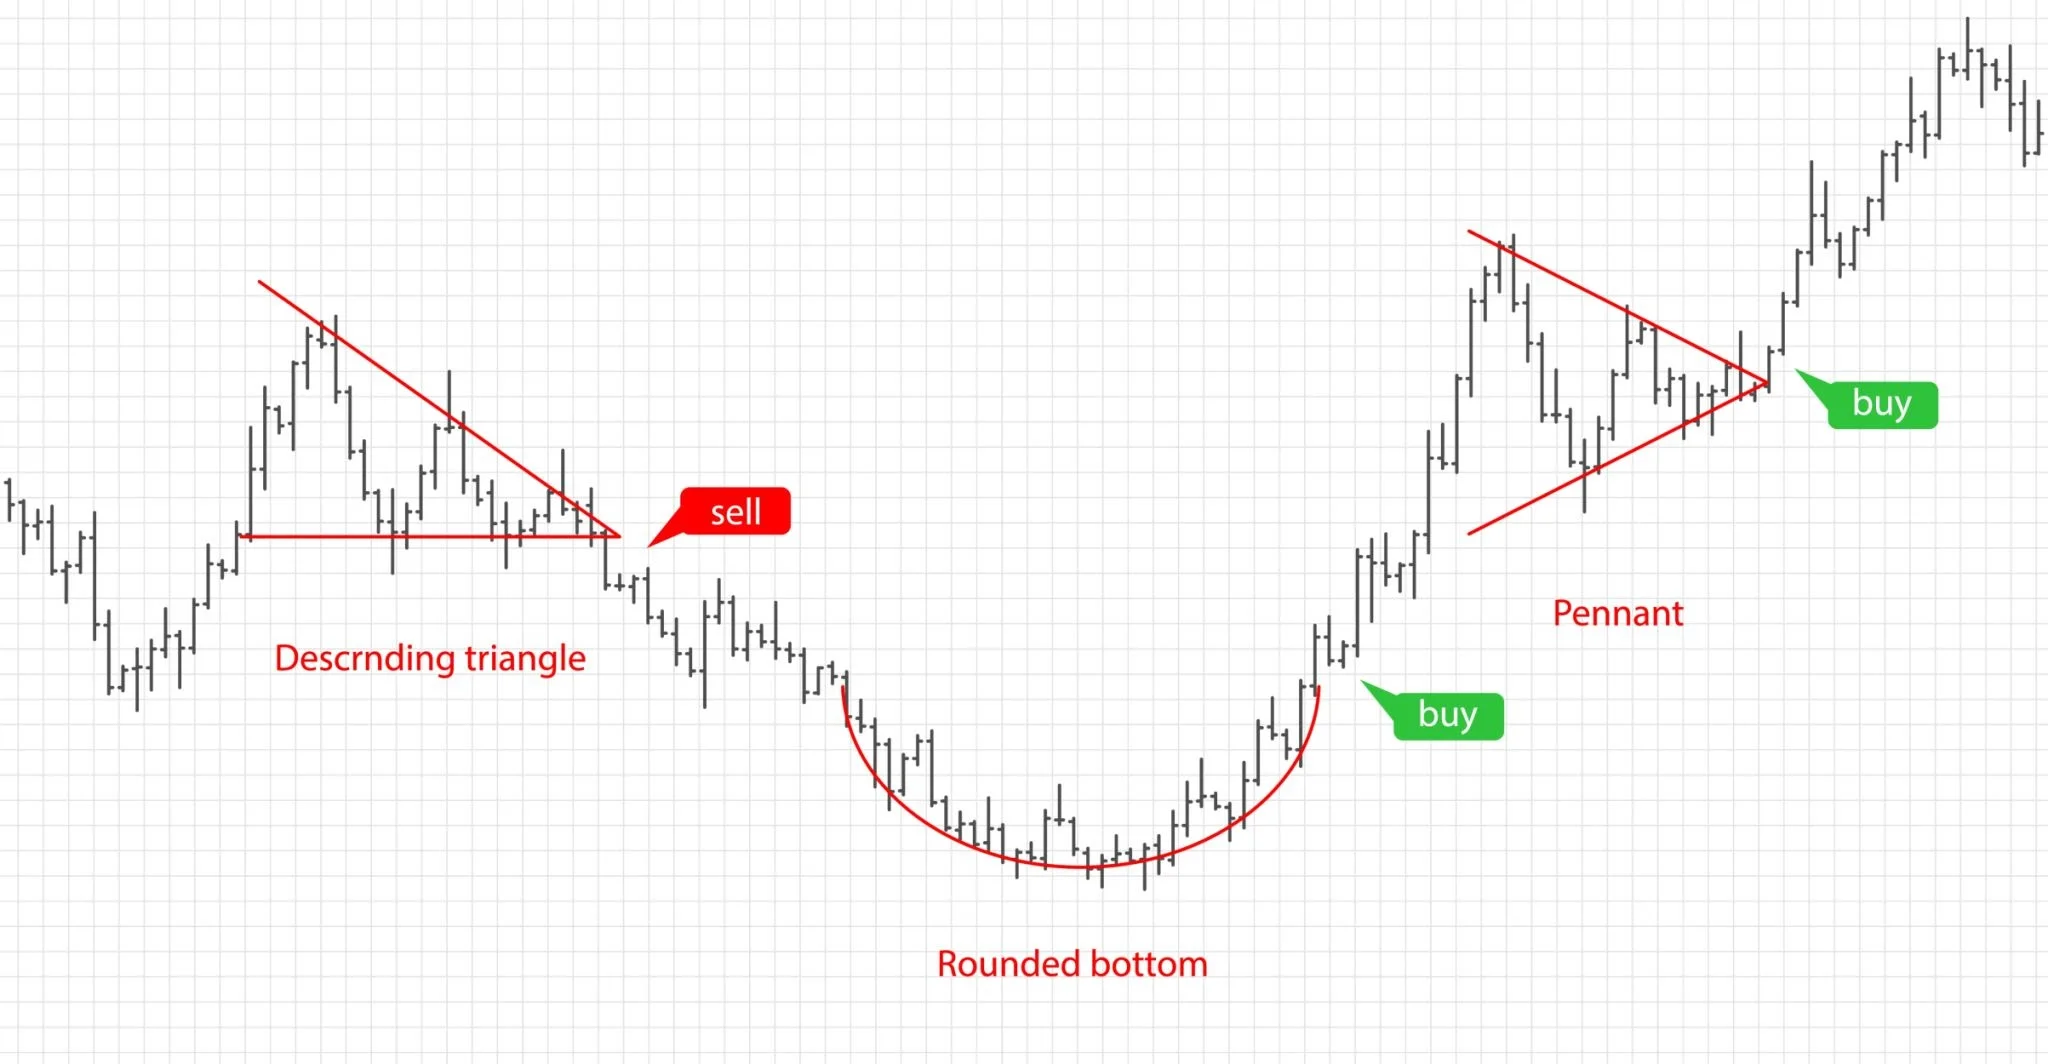
The Rounding Bottom forms over a long period—often several weeks or even months on a daily chart. It looks exactly like a wide, shallow bowl or saucer.
📉 The Decline: The stock is in a downtrend, but the selling pressure is slowly fading. The downward slope becomes less and less steep.
🥣 The Flat Bottom (Accumulation): The price bottoms out and moves sideways in a tight, quiet range. This forms the base of the saucer.
📈 The Advance: Buyers slowly take control, and the price begins to curve upward, completing the right side of the "U" shape.
🚀 The Breakout: The price reaches the "neckline" (the resistance level where the initial downtrend started to curve) and breaks above it, confirming a massive new bull run.
The Psychology: Quiet Accumulation
The magic of the Rounding Bottom lies in its boring nature. Because this pattern takes so long to form, average retail investors completely lose interest in the stock during the "Flat Bottom" phase.
This is exactly what institutional buyers want. Big players (like mutual funds or large private investors) cannot buy millions of shares all at once without causing the price to skyrocket. So, they buy quietly and slowly during this flat period.
This steady accumulation smoothly absorbs any remaining selling pressure. As the supply of shares dries up, the price naturally starts to curve upward. By the time the impatient retail crowd realizes a new uptrend has started, the smart money has already built a massive, highly profitable position.
How to Trade It Safely in NEPSE
Because this is a long-term pattern, patience is heavily rewarded:
🚦 The Entry Signal: Do not buy blindly at the absolute bottom of the saucer—it could just be a long sideways trap. Wait for the price to curve all the way up and clearly break above the neckline resistance.
📊 The Volume Bowl: Volume is the key to confirming this pattern. Trading turnover should be high during the initial decline, dry up completely at the flat bottom of the saucer, and steadily increase as the price curves upward. A massive volume spike on the breakout day is your ultimate confirmation.
🛡️ The Stop Loss: Once you buy the breakout, place your stop loss slightly below the breakout line (the neckline).
🎯 The Target: Measure the total depth of the saucer (from the neckline down to the lowest point of the bowl). Add that distance to your breakout point to calculate your long-term profit target.
🎯 Next Move for Laganikartas: Scan your NEPSE charts on a weekly timeframe to filter out the daily noise. If you see a stock that has been slowly curving into a bowl shape for months, set an alert near its neckline and get ready for a powerful breakout. ➡️ What happens if a Rounding Bottom fails to break out immediately? Read our guide on the Cup and Handle pattern here.