
In the Nepal Stock Exchange (NEPSE), you will often see a scrip that just can't seem to get past a specific price. Every time it hits, say, Rs. 500, it gets knocked back down. But if you look closely at the chart, you might notice something bullish happening: the pullbacks are getting shallower.
This creates an Ascending Triangle, one of the most reliable bullish continuation patterns. It shows a clear battle between stubborn sellers and aggressive buyers—and in this pattern, the buyers are mathematically primed to win.
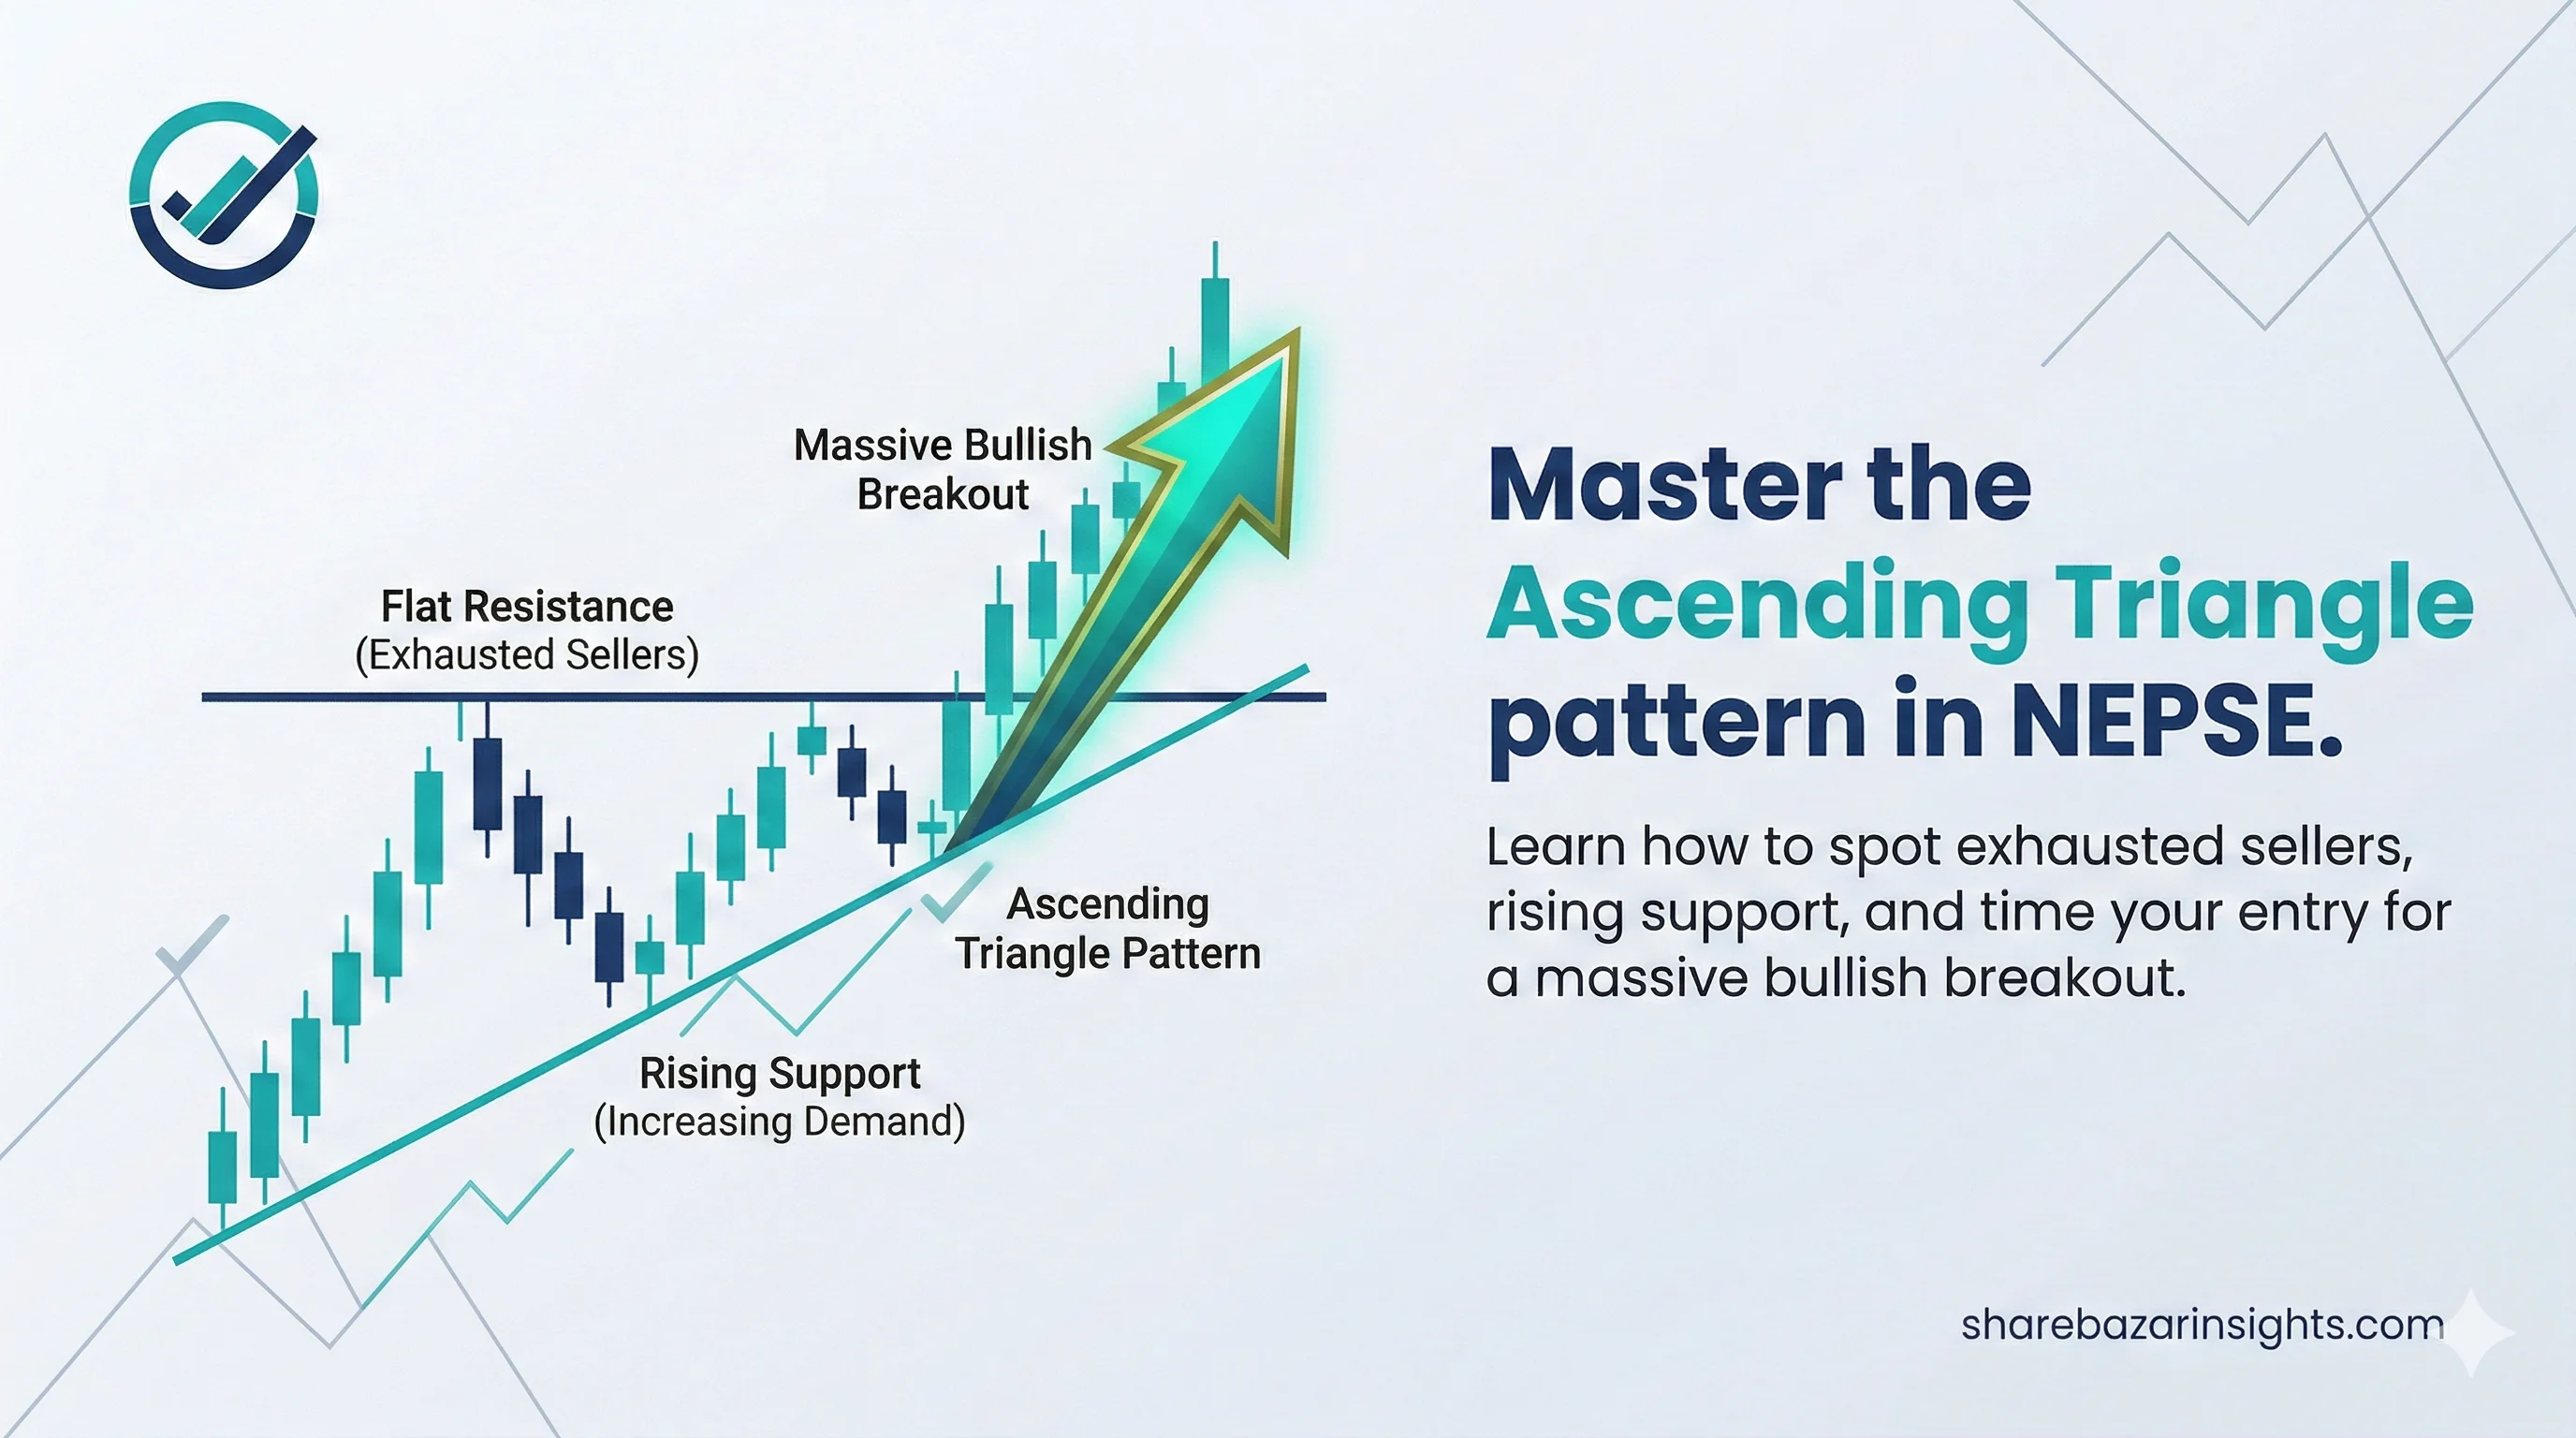
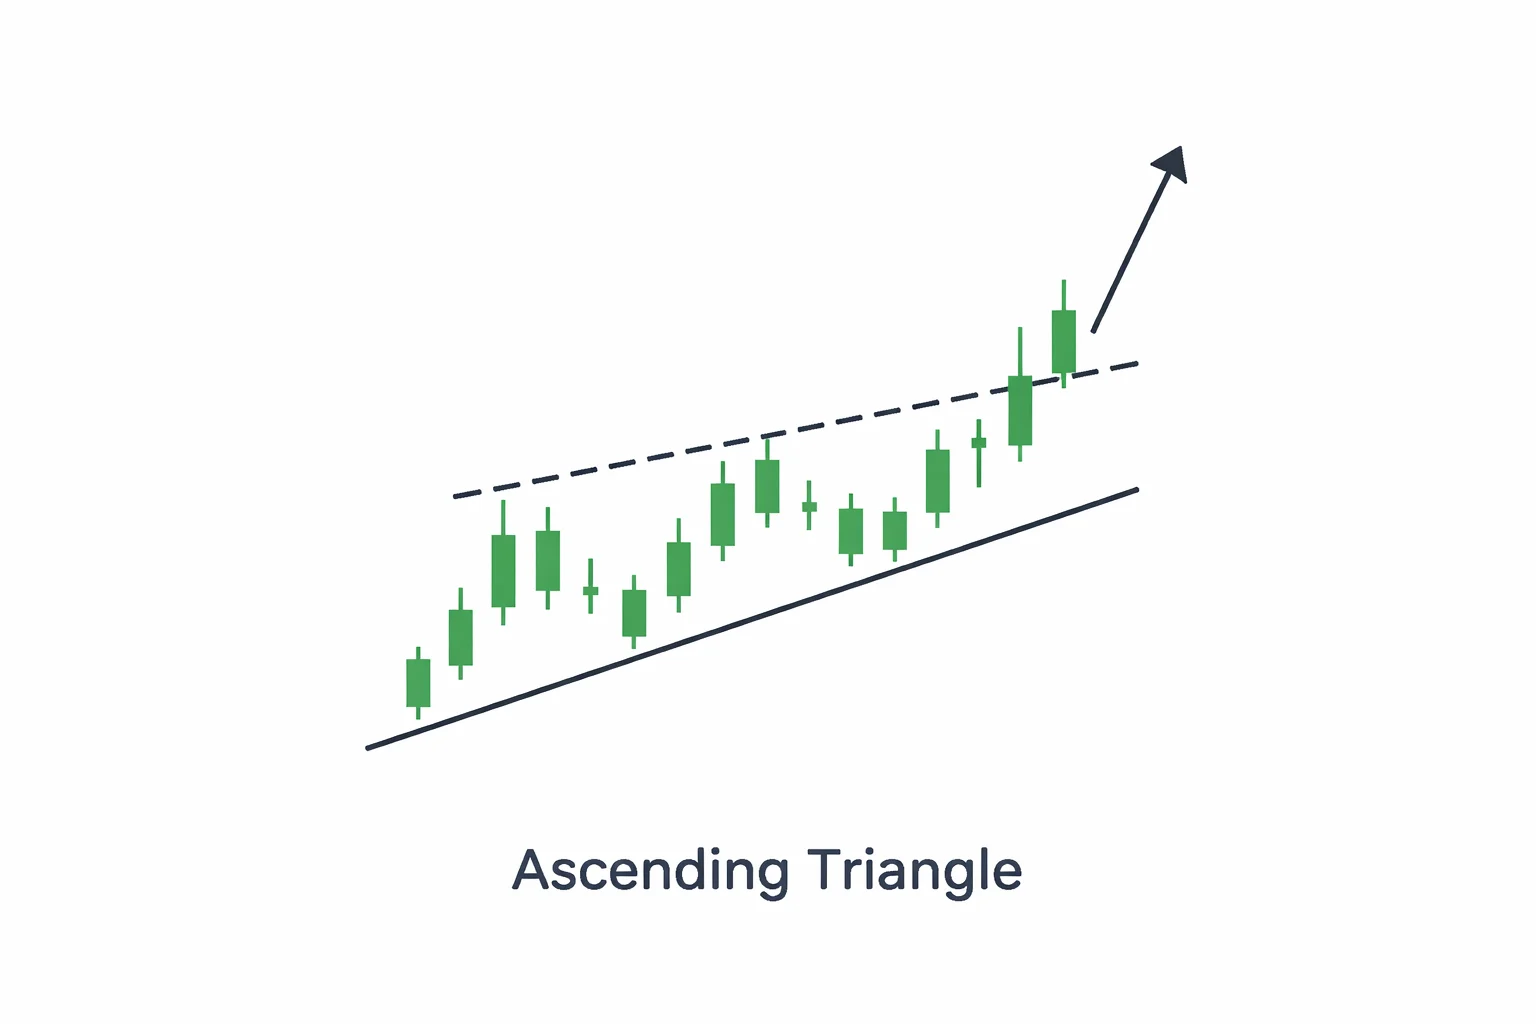
Anatomy of the Ascending Triangle
This pattern looks like a right-angled triangle pointing upward, formed by two distinct trendlines:
🛑 The Flat Ceiling (Resistance): A horizontal upper line connecting two or more highs at the exact same price level. This is where sellers are heavily positioned.
📈 The Rising Floor (Support): An upward-sloping lower line connecting a series of higher lows. This shows buyers are stepping in earlier and earlier.
🚀 The Breakout: The space between the floor and the ceiling gets squeezed until the price forcefully breaks above the flat resistance line.
 The Psychology: Exhausting the Supply
As you watch an Ascending Triangle form, you are watching the sellers run out of ammunition.
At first, the sellers have a massive supply of shares at the resistance line. But the buyers are highly motivated. Because they believe the scrip's fundamental value is higher, they don't wait for the price to drop back to its previous low—they buy the dip early, creating the rising floor.
Eventually, the sellers don't have enough shares left to hold the buyers back. The supply wall collapses. Once the resistance is broken, it flips into a new support level, and the stock triggers a fresh rally as sidelined laganikartas rush in to join the trend.
How to Trade It Safely in NEPSE
🚦 The Entry: Patience is key. Do not buy while the stock is still trapped inside the triangle, as it could face a rare downside rejection. Wait for a daily candle to close cleanly above the flat resistance line.
📊 Volume Confirmation: The breakout must be fueled by a noticeable spike in daily turnover. High volume proves that the institutional buyers have stepped in to push the price through the ceiling.
🛡️ The Stop Loss: Place your stop loss just below the rising support line, or slightly below the most recent "higher low" inside the triangle.
🎯 The Target: Measure the height of the thickest part of the triangle (the beginning of the pattern). Add that measurement to the breakout price to find your target.
🎯 Next Move for Laganikartas: Identify key resistance levels on your favorite NEPSE scrips. If a stock is tapping a resistance repeatedly while making higher lows, put it on your high-priority watchlist.