
In the Nepal Stock Exchange (NEPSE), enduring a long bear market can be emotionally draining. Watching your portfolio drop day after day makes many laganikartas afraid to ever buy again. However, the market always leaves clues when the worst is finally over.
One of the most famous and reliable bullish reversal signals in technical analysis is the Double Bottom chart pattern. Often called the "W" pattern, it signals that the sellers are completely exhausted, a firm price floor has been built, and a massive new uptrend is about to begin.
Anatomy of a Double Bottom
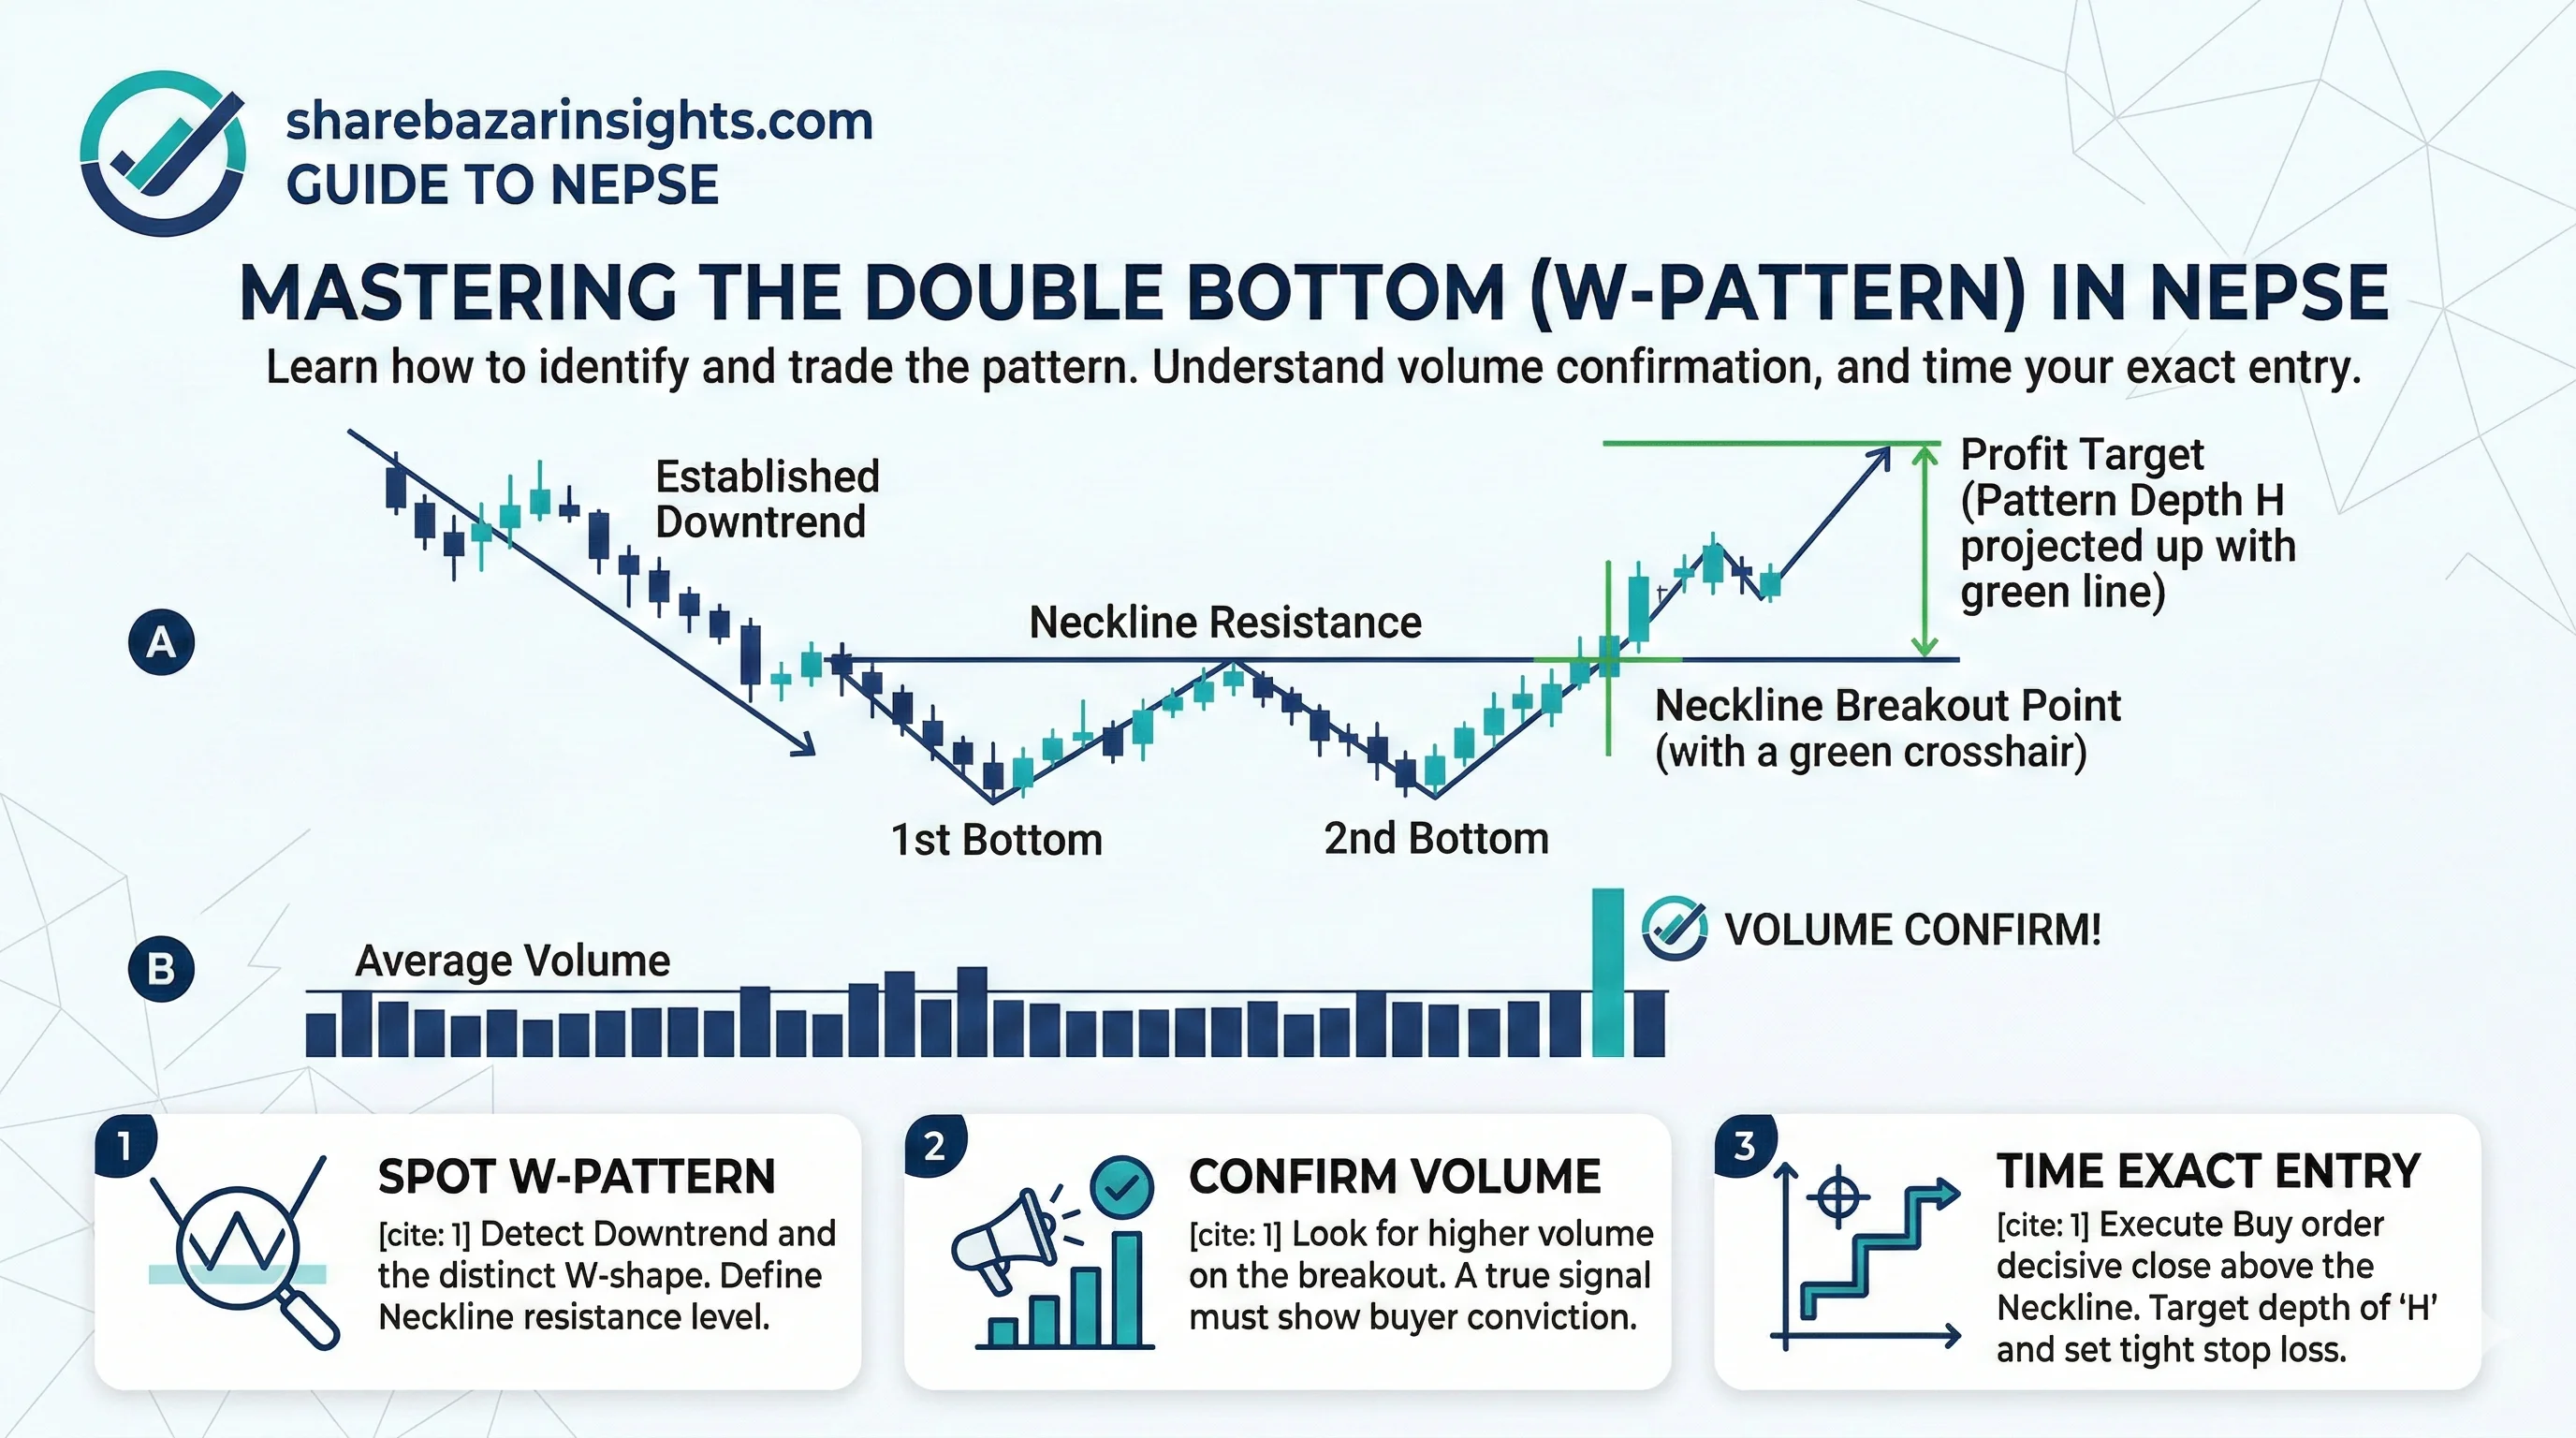
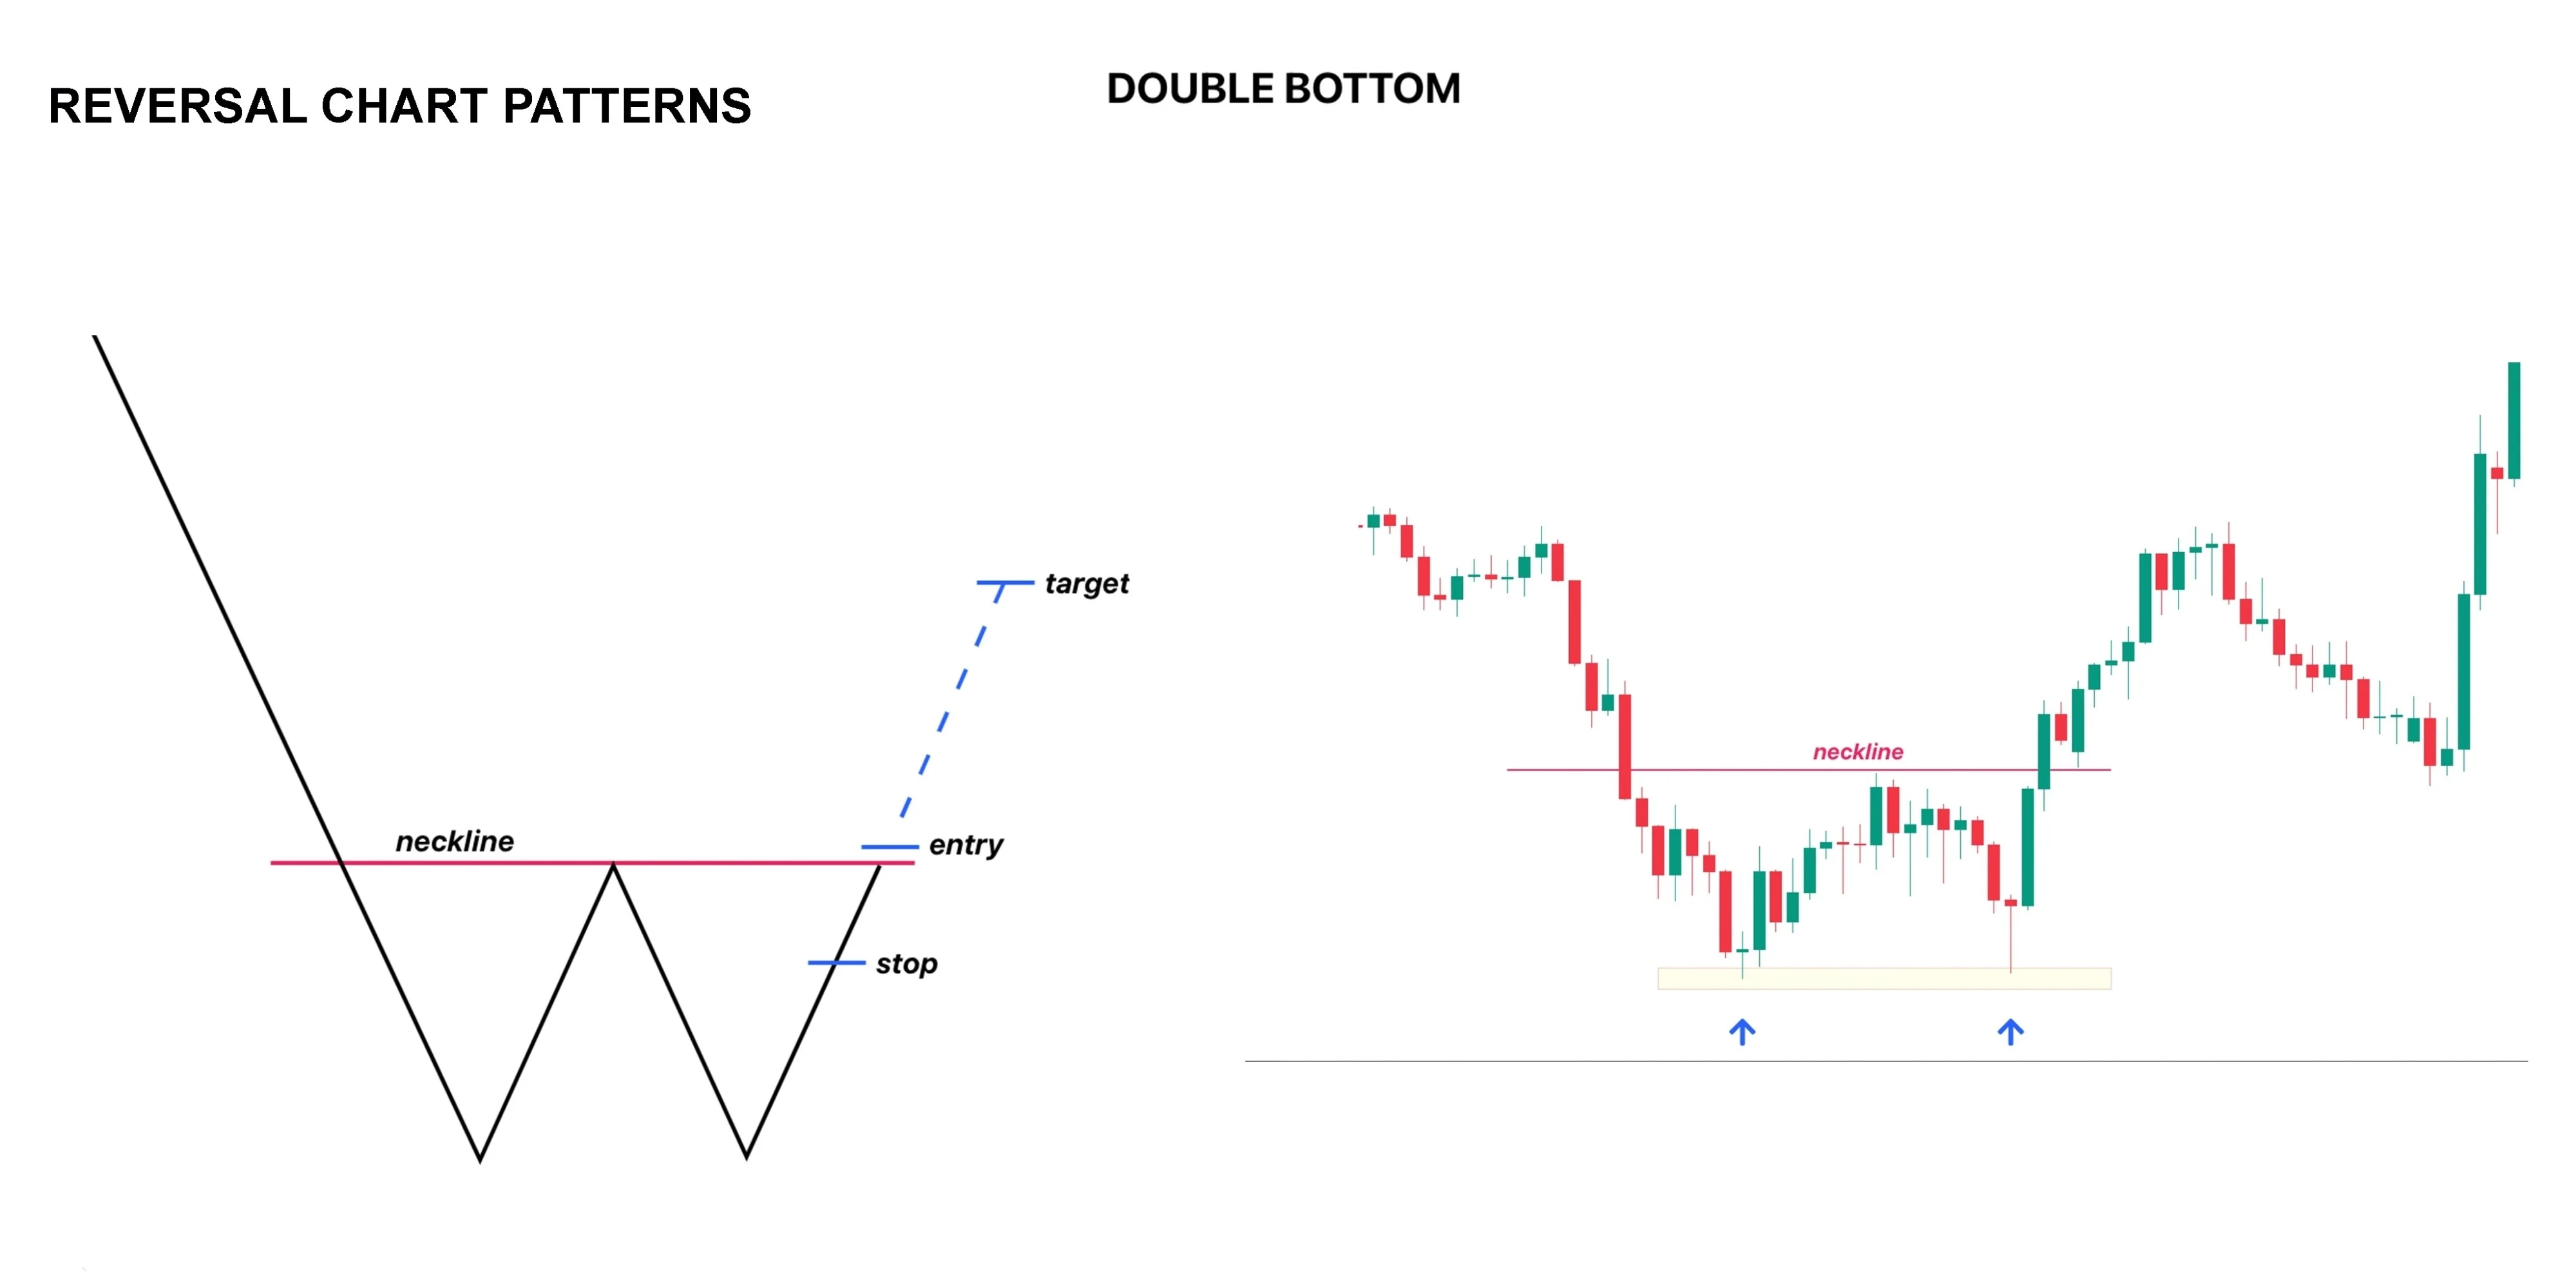
A Double Bottom forms at the absolute lowest point of a major downtrend. It visually resembles the letter "W" and develops in four distinct steps:
📉 The First Bottom: The stock crashes to a new low, hits a wall of buying pressure, and bounces upward. This establishes a firm support level (the floor).
🛑 The Neckline: The bounce eventually runs out of steam, and the price peaks, establishing a temporary resistance level known as the "neckline."
📉 The Second Bottom: Sellers step back in and push the price down one more time. However, they hit a brick wall at the exact same support level as the First Bottom. The price bounces back up.
🚀 The Breakout: The buyers take total control, pushing the price forcefully above the neckline resistance, confirming the reversal and triggering a new bull market.
The Psychology: The Failure of the Bears
The psychology behind the Double Bottom is a story of failed panic and hidden strength.
When the stock drops from the neckline to form the Second Bottom, terrified retail investors assume the crash is resuming. They panic-sell to get out. But why doesn't the price drop lower than the First Bottom? Because institutional investors (the "smart money") recognize the stock is heavily undervalued.
They step in at that exact support level and quietly absorb millions of shares from the panicked retail crowd. When the sellers realize they cannot push the price to a new low, they give up. The lack of selling pressure combined with aggressive institutional buying causes the price to explode upward, forming the right side of the "W."
How to Trade It Safely in NEPSE
In NEPSE, you trade this pattern by waiting for confirmation that the smart money has officially won the battle:
🚦 The Entry Signal: Do not buy just because the price hits the second bottom! The support could still break. The pattern is only confirmed when a daily candlestick completely closes above the neckline. That breakout is your definitive signal to buy.
📊 Watch the Turnover: Pay close attention to NEPSE trading volume. You want to see the volume dry up as the Second Bottom forms (showing a lack of sellers). When the price breaks above the neckline, it must be accompanied by a massive surge in volume to confirm the institutional buying.
🛡️ The Stop Loss: Once you buy the breakout, place your strict stop loss slightly below the massive support floor of the "W." If the price drops below that floor, the setup is dead.
🎯 The Target: Measure the vertical distance between the bottom support floor and the neckline. Add that exact distance to the neckline breakout point to calculate your minimum profit target.
🎯 Next Move for Laganikartas: Never try to catch a falling knife. Let the "W" form, wait patiently for the buyers to prove their strength at the neckline, and set your price alerts for the breakout!