
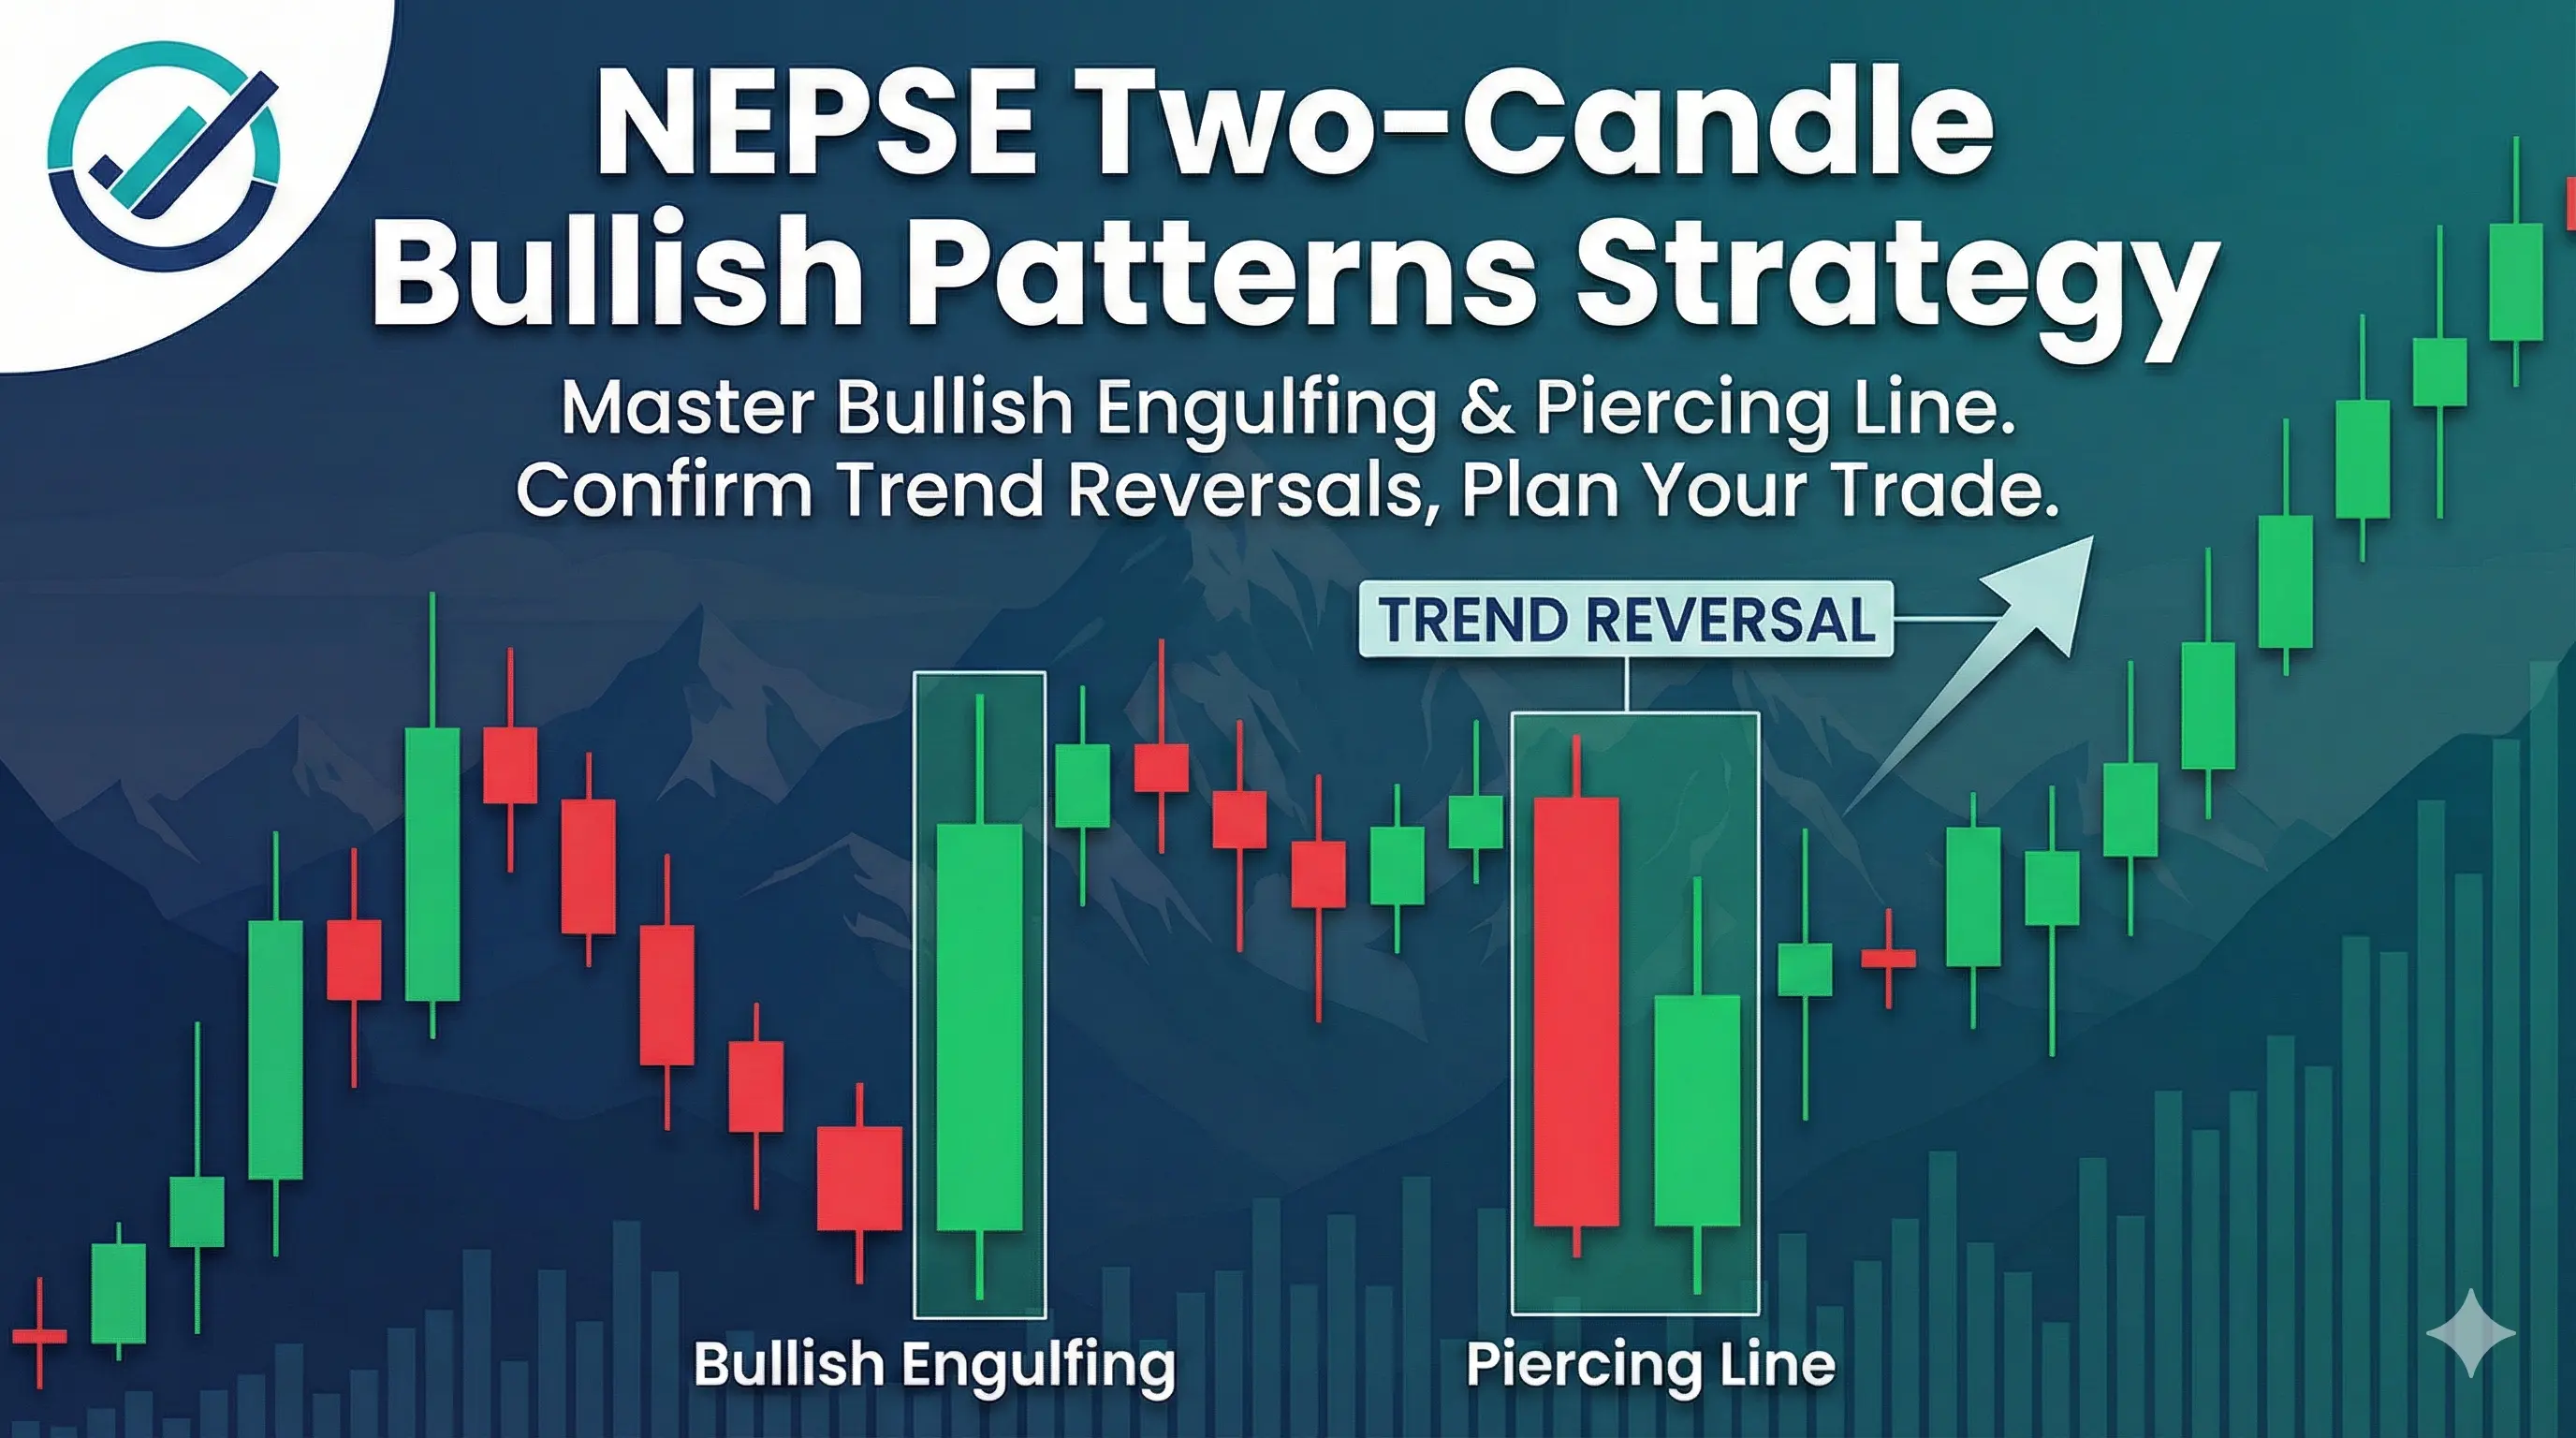
5 Two-Candle Bullish Patterns Every NEPSE Trader Should Master
If you have been trading in the NEPSE for a while, you already know that single-day market movements can sometimes be deceptive. A single green candle might look like a bottom, but the very next day, the kheladis dump their shares, and you are left trapped in a "bull trap" or fakeout.
This is why experienced technical analysts in Nepal heavily rely on Two-Candle Bullish Patterns. By analyzing two consecutive trading days together, you get a much clearer picture of the tug-of-war between buyers and sellers. Two-candle formations act as their own built-in confirmation. They tell you not just that the bears are exhausted, but that the bulls have actually stepped in with enough capital and volume to take control of the TMS.
Whether you are looking for a quick swing trade or accumulating fundamentally strong dividend-paying stocks at a discount, these five two-candle patterns will significantly improve your entry accuracy. Let’s break down exactly what to look for on your charts:
The Bullish Engulfing: Total domination by the buyers.
The Piercing Line: A sharp, unexpected momentum shift.
The Bullish Harami: The sudden halt of selling pressure.
The Tweezer Bottom: A rock-solid test of NEPSE support zones.
The Bullish Kicker: An explosive gap-up driven by strong fundamentals or news.
(Note: Click on any of the candlestick names above to jump into our dedicated, deep-dive strategy guides for each specific pattern!)
1. The Bullish Engulfing: Total Buyer Domination
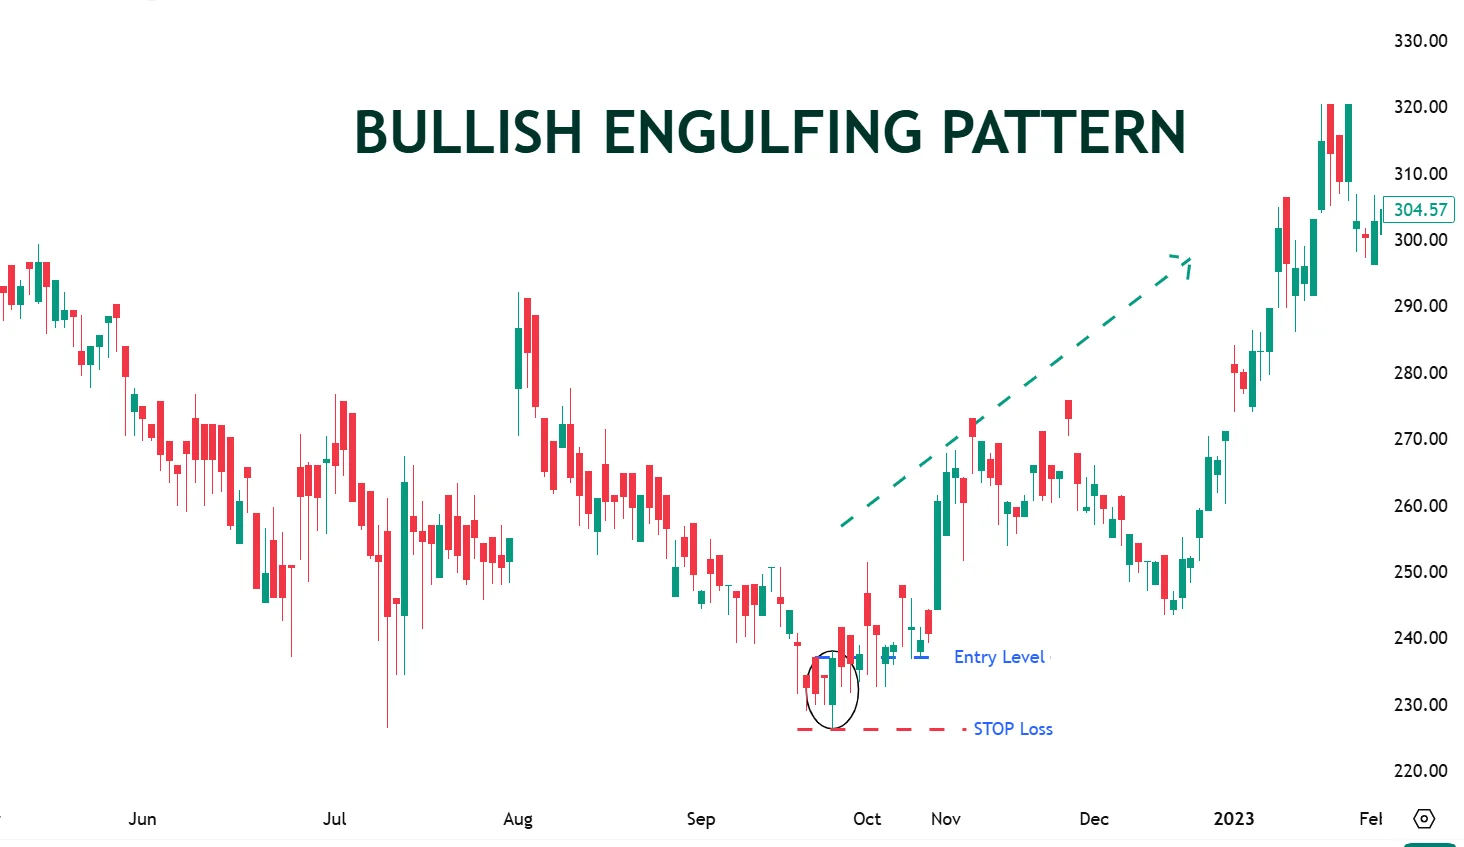
What it looks like: A smaller red (bearish) candle on Day 1, followed by a much larger green (bullish) candle on Day 2. The green body completely "engulfs" or covers the real body of the previous day's red candle.
The Psychology in NEPSE: After a prolonged downtrend, sellers are still in control on Day 1. However, on Day 2, heavy buying pressure suddenly enters the market. The bulls push the price so high that it entirely erases the previous day's losses. In the Nepali market, when this pattern forms with high turnover (volume), it means institutional buyers and mutual funds are aggressively accumulating kitta.
Your Next Move: This is one of the strongest reversal signals. If the Bullish Engulfing pattern forms at a major support level or the lower band of the Bollinger Bands, prepare to enter. You can buy near the close of the second day or at the market open on the third day, placing your stop-loss just below the low of the engulfing green candle.
Deep Dive: 👉 Read our complete strategy guide on trading the Bullish Engulfing Pattern in NEPSE here.
2. The Piercing Line: The Surprise Comeback
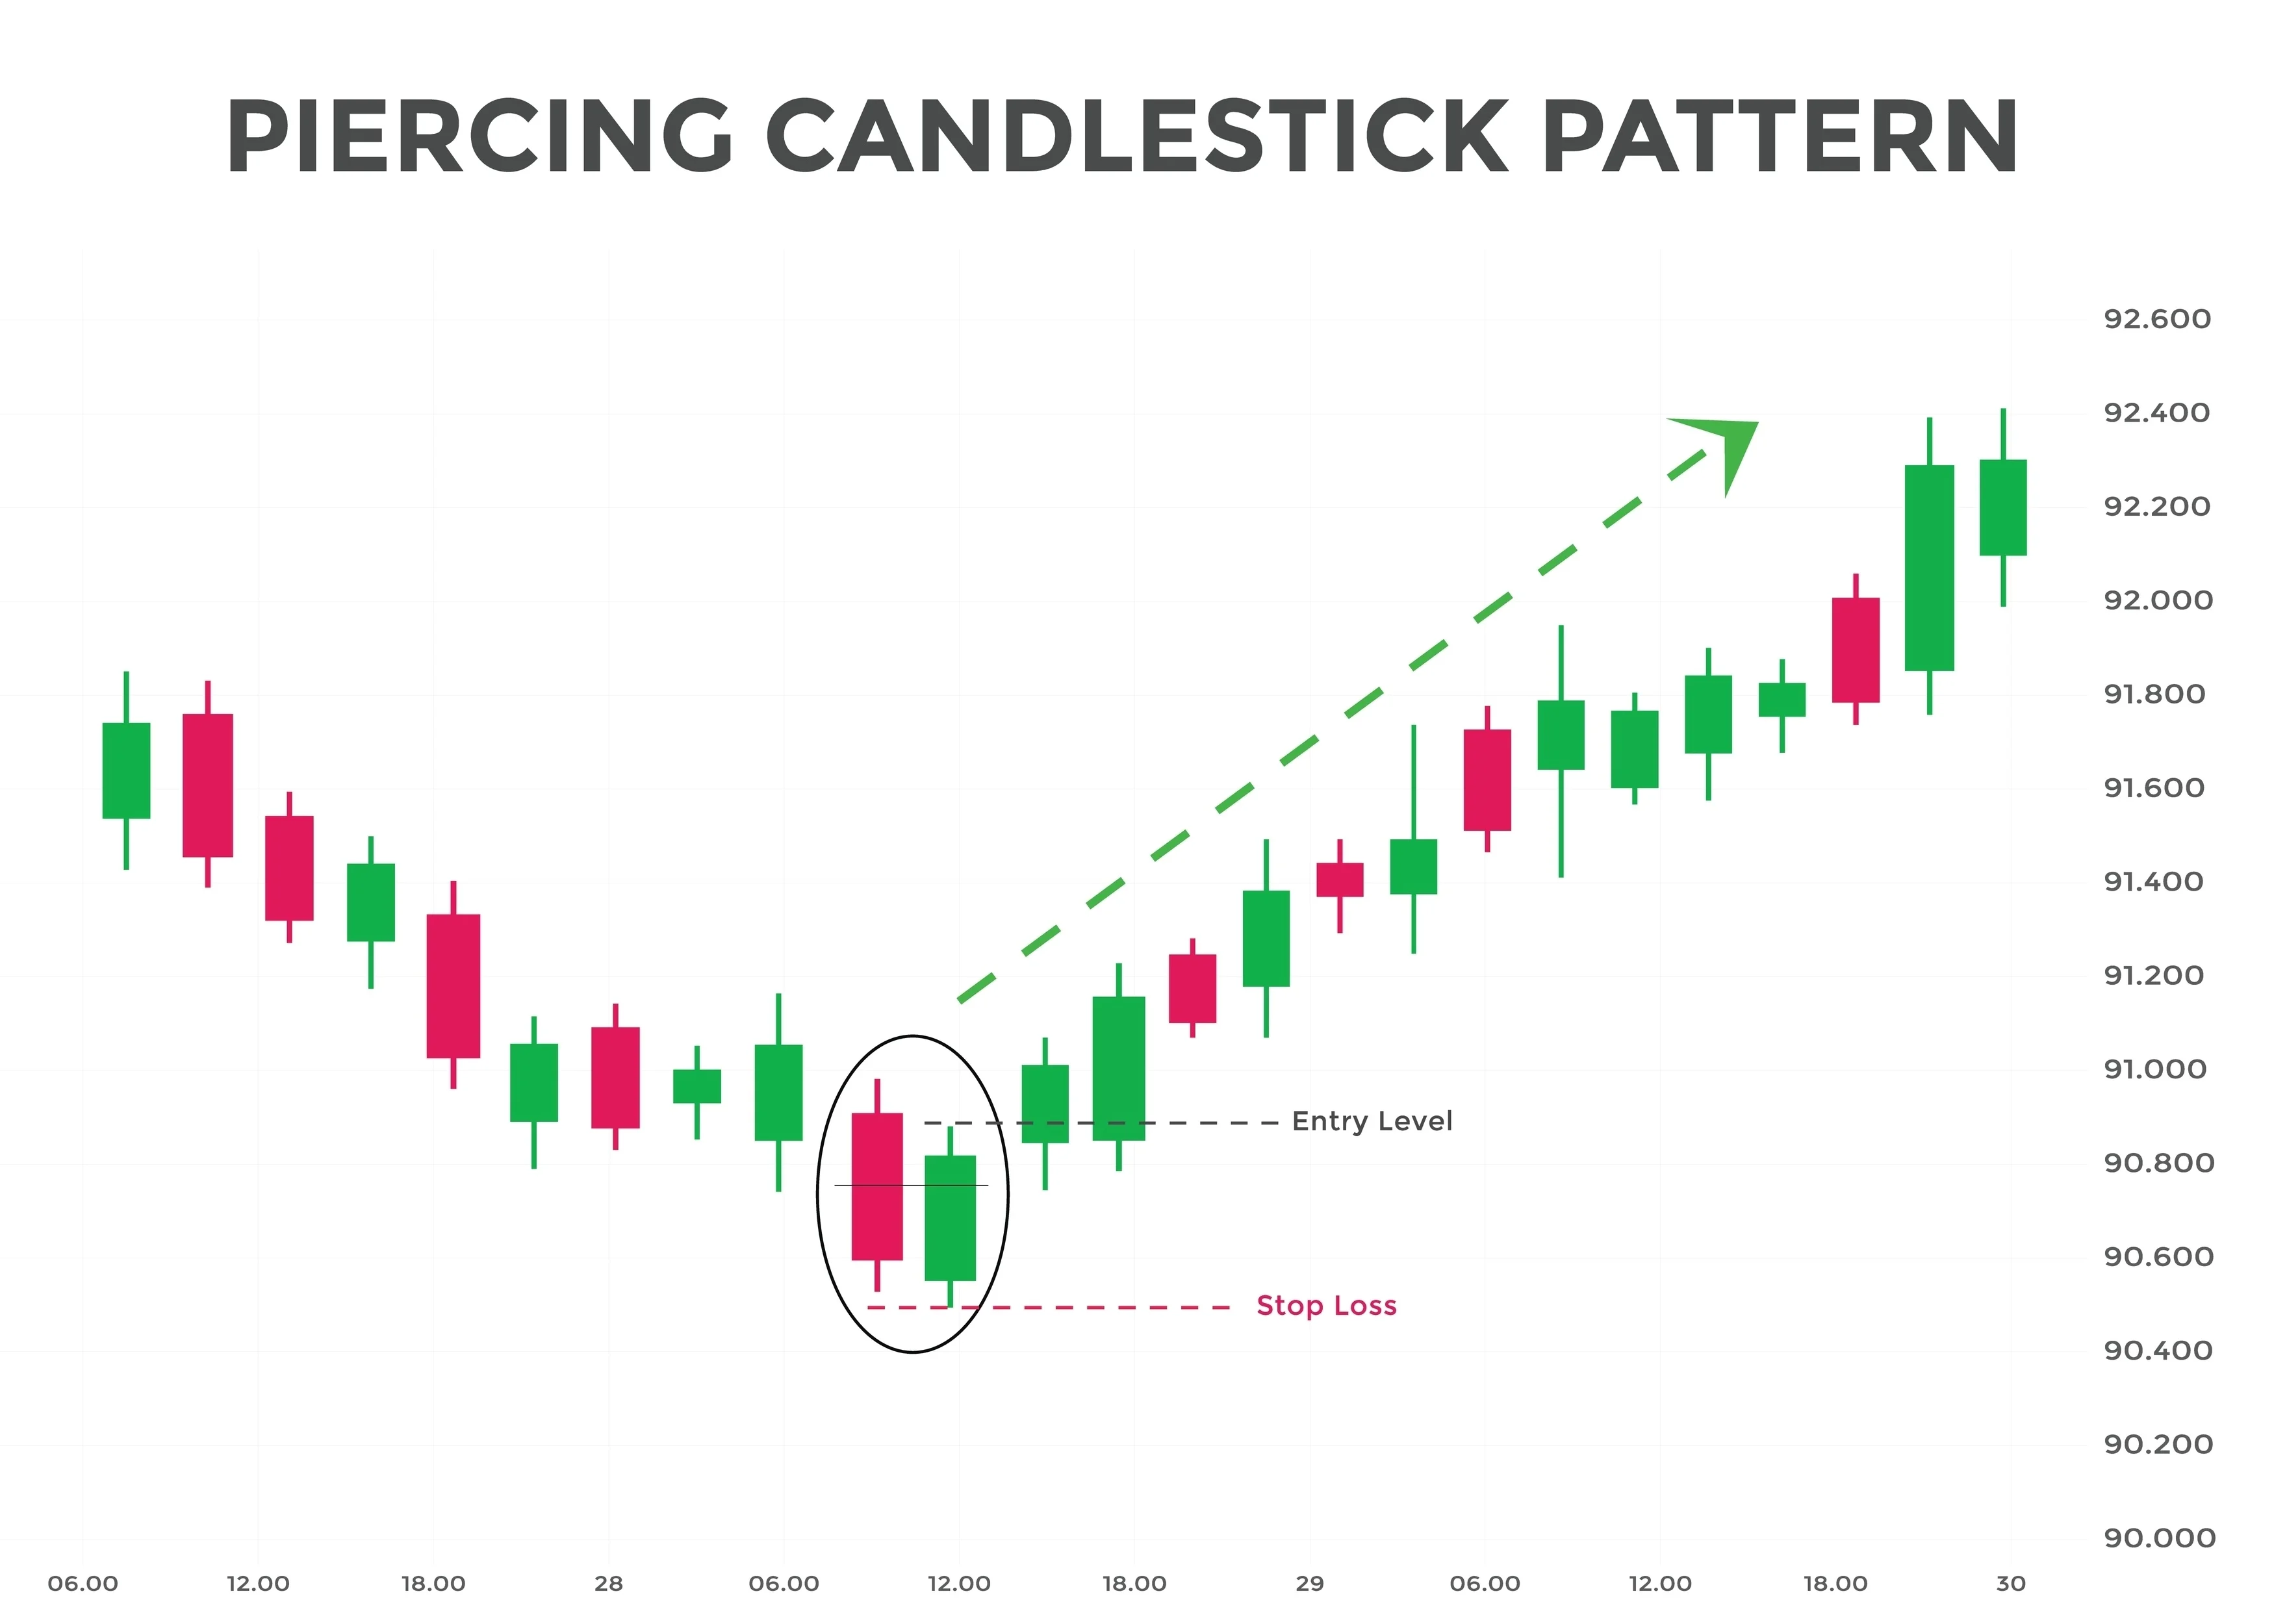
What it looks like: A long red candle on Day 1. On Day 2, the market opens with a "gap down" (lower than the previous day's close) but then rallies strongly to close above the 50% mark (midpoint) of Day 1's red body.
The Psychology in NEPSE: This pattern perfectly captures pre-market panic followed by intraday recovery. Imagine bad news hitting the market, causing intense selling pressure in the pre-open session (10:30 AM - 10:45 AM). The stock opens lower, but smart investors realize the asset is severely undervalued. They buy the dip aggressively, pushing the price deep into yesterday's territory.
Your Next Move: Because the price still closed below Day 1's open, you need to wait for a third confirmation candle to close green before going all-in. Keep a close eye on the RSI (Relative Strength Index); if it's showing bullish divergence alongside a Piercing Line, it's a high-probability setup.
Deep Dive: 👉 Learn exactly how to spot and trade the Piercing Line pattern here.
3. The Bullish Harami: The Selling Comes to a Halt
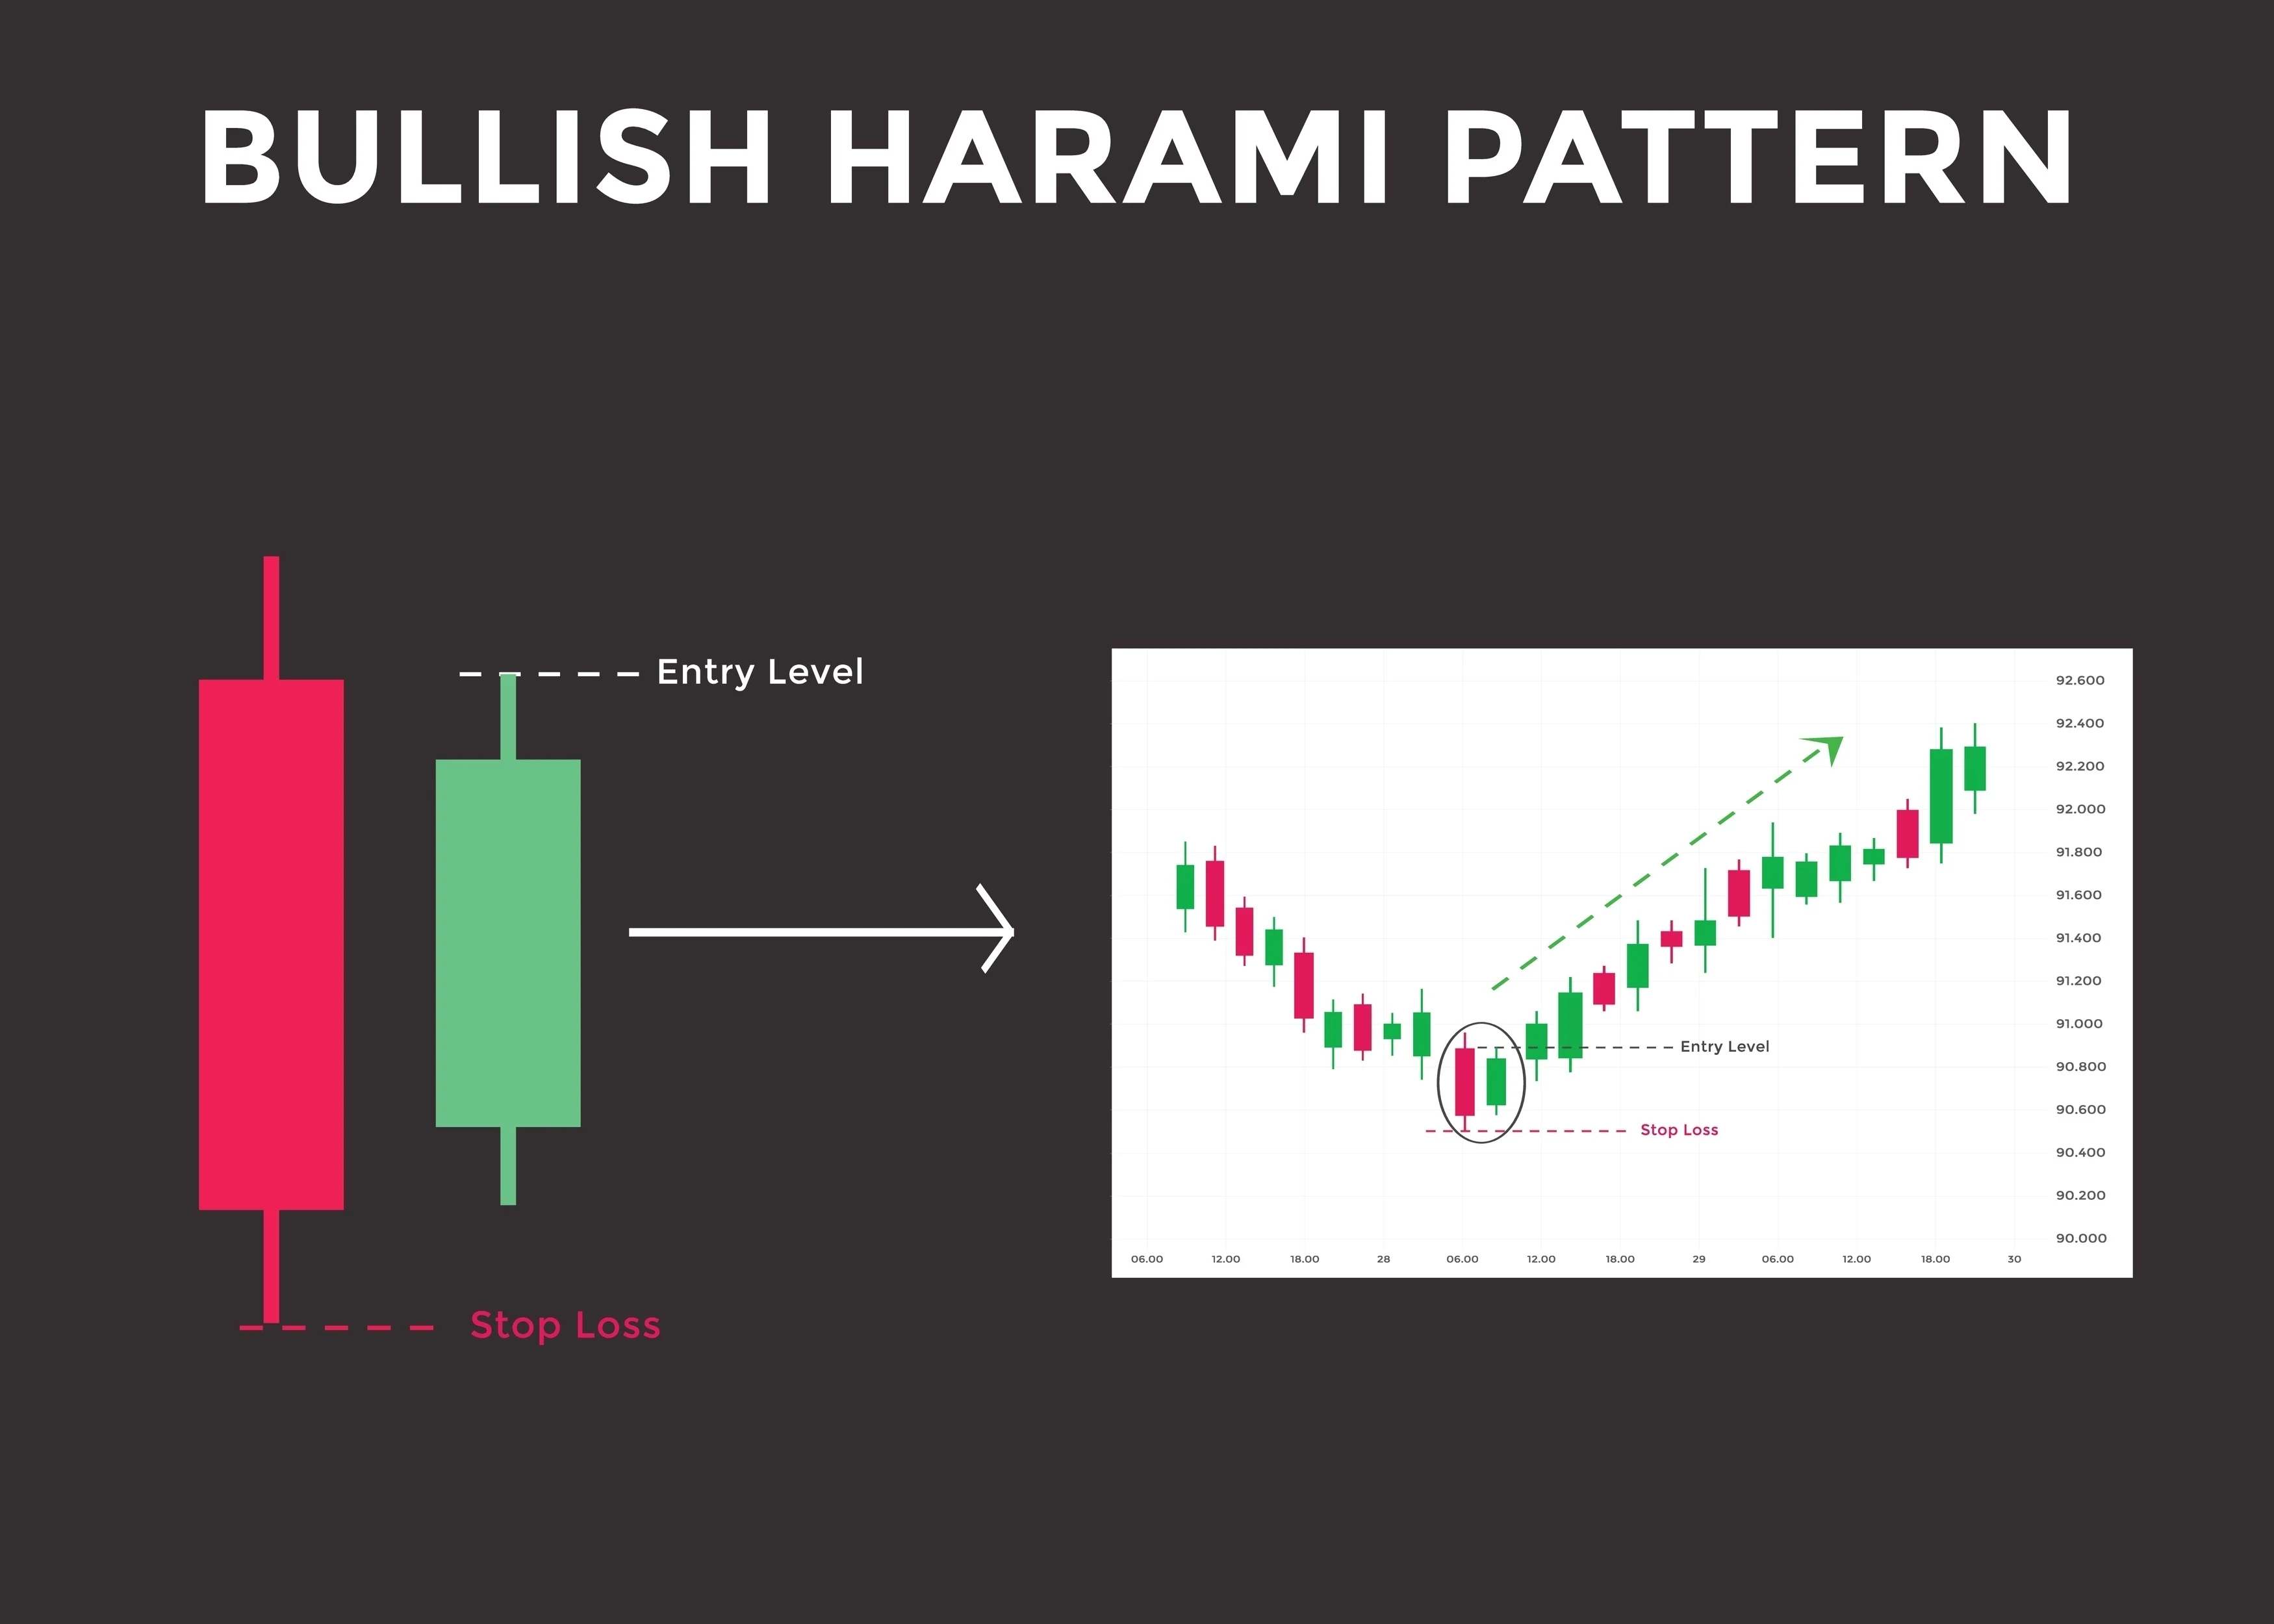
What it looks like: A long red candle on Day 1, followed by a small green candle on Day 2. The entire body of the small green candle is contained within the vertical range of the large red candle (like a pregnant mother, which is what "Harami" means in old Japanese).
The Psychology in NEPSE: Unlike the Engulfing pattern where bulls roar into the market, the Harami shows that the bears have simply run out of steam. The heavy selling from Day 1 stops abruptly, and the market consolidates. It is an early warning sign that the downtrend is losing momentum and a reversal is brewing.
Your Next Move: Do not rush! The Bullish Harami is a warning, not a green light. Wait for the stock to break above the high of the Day 1 red candle. Once the market structure breaks upward, you can execute your trade safely.
Deep Dive: 👉 Master the Bullish Harami and avoid false breakouts here.
4. The Tweezer Bottom: The Double Test of Support
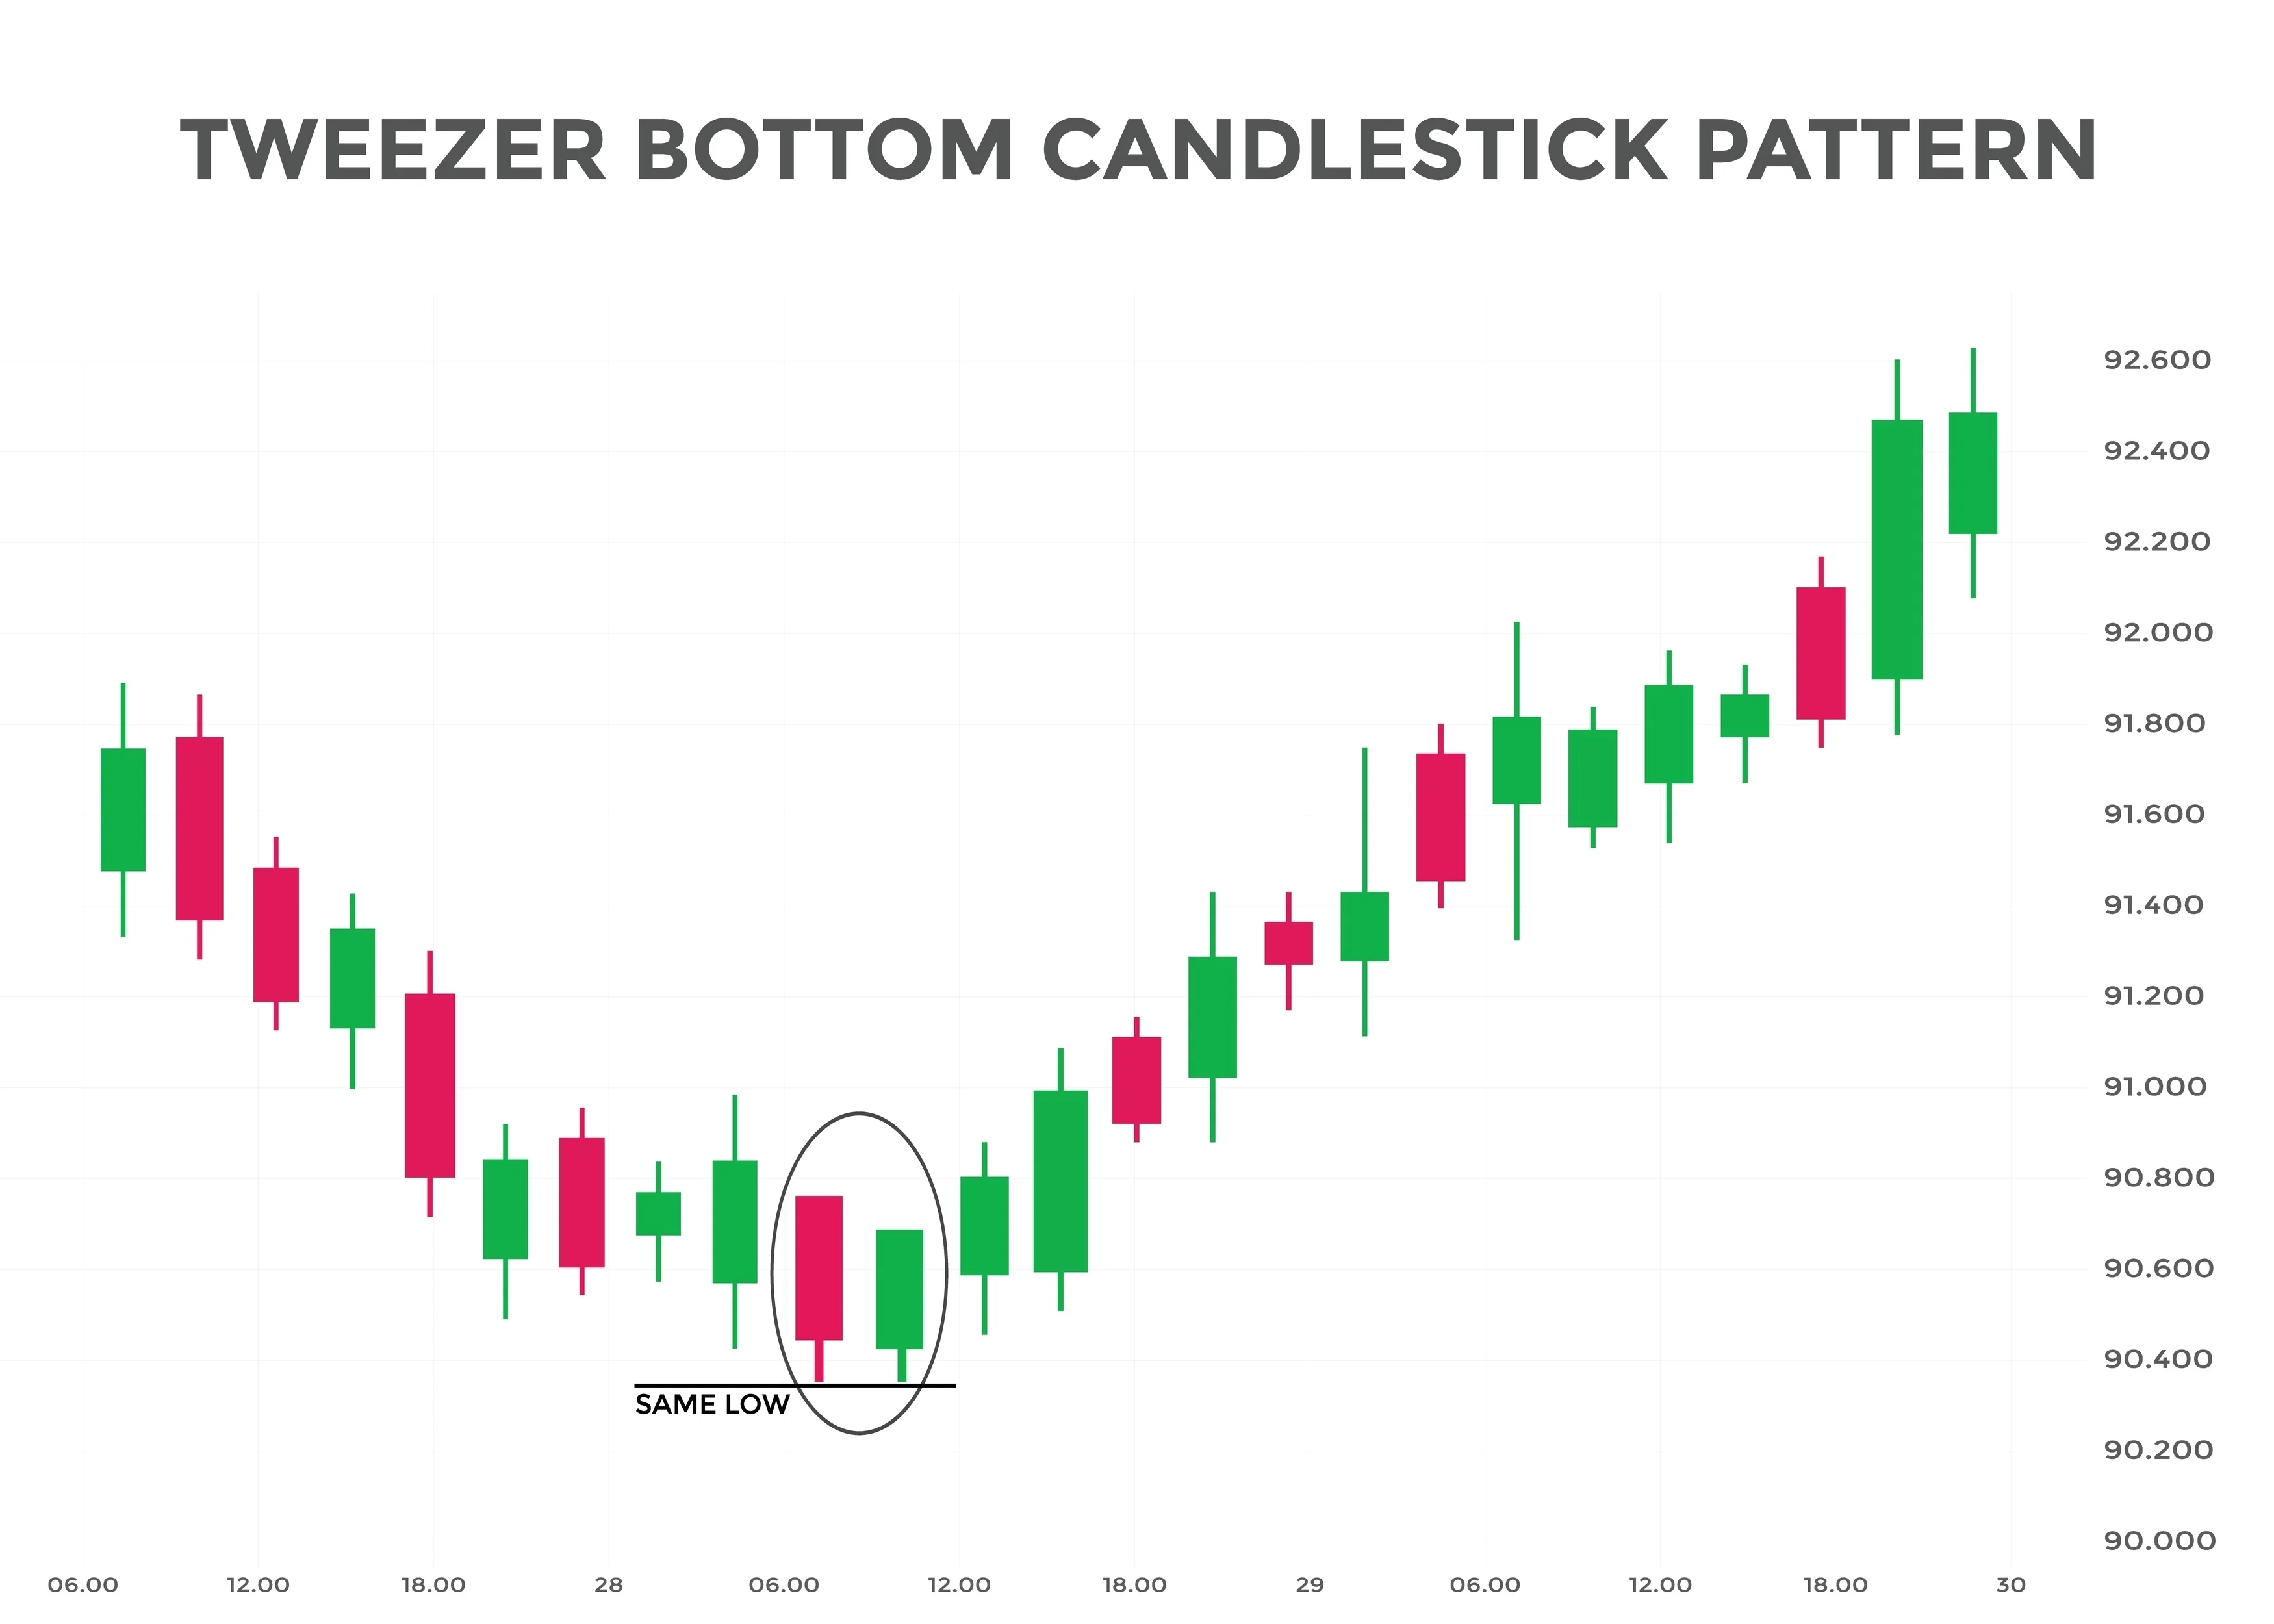
What it looks like: Two candlesticks (typically one red, then one green) that have matching, or nearly matching, lows. They look like a pair of tweezers touching the exact same bottom price level.
The Psychology in NEPSE: The market tried to push the price down to a specific level on Day 1 and was rejected. On Day 2, sellers tried to crash the price to that exact same level again, and buyers stepped in to defend it once more. In NEPSE, this shows a concrete floor has been established. No matter how much panic selling happens, buyers refuse to let the stock drop below that specific price point.
Your Next Move: Tweezer Bottoms are incredibly reliable when they align with historical support zones or moving averages (like the 50-day EMA). You can confidently take an entry, knowing exactly where your stop-loss should go (just a few rupees below the twin lows).
Deep Dive: 👉 Discover how to trade Tweezer Bottoms for low-risk, high-reward entries here.
5. The Bullish Kicker: The Explosive Gap-Up
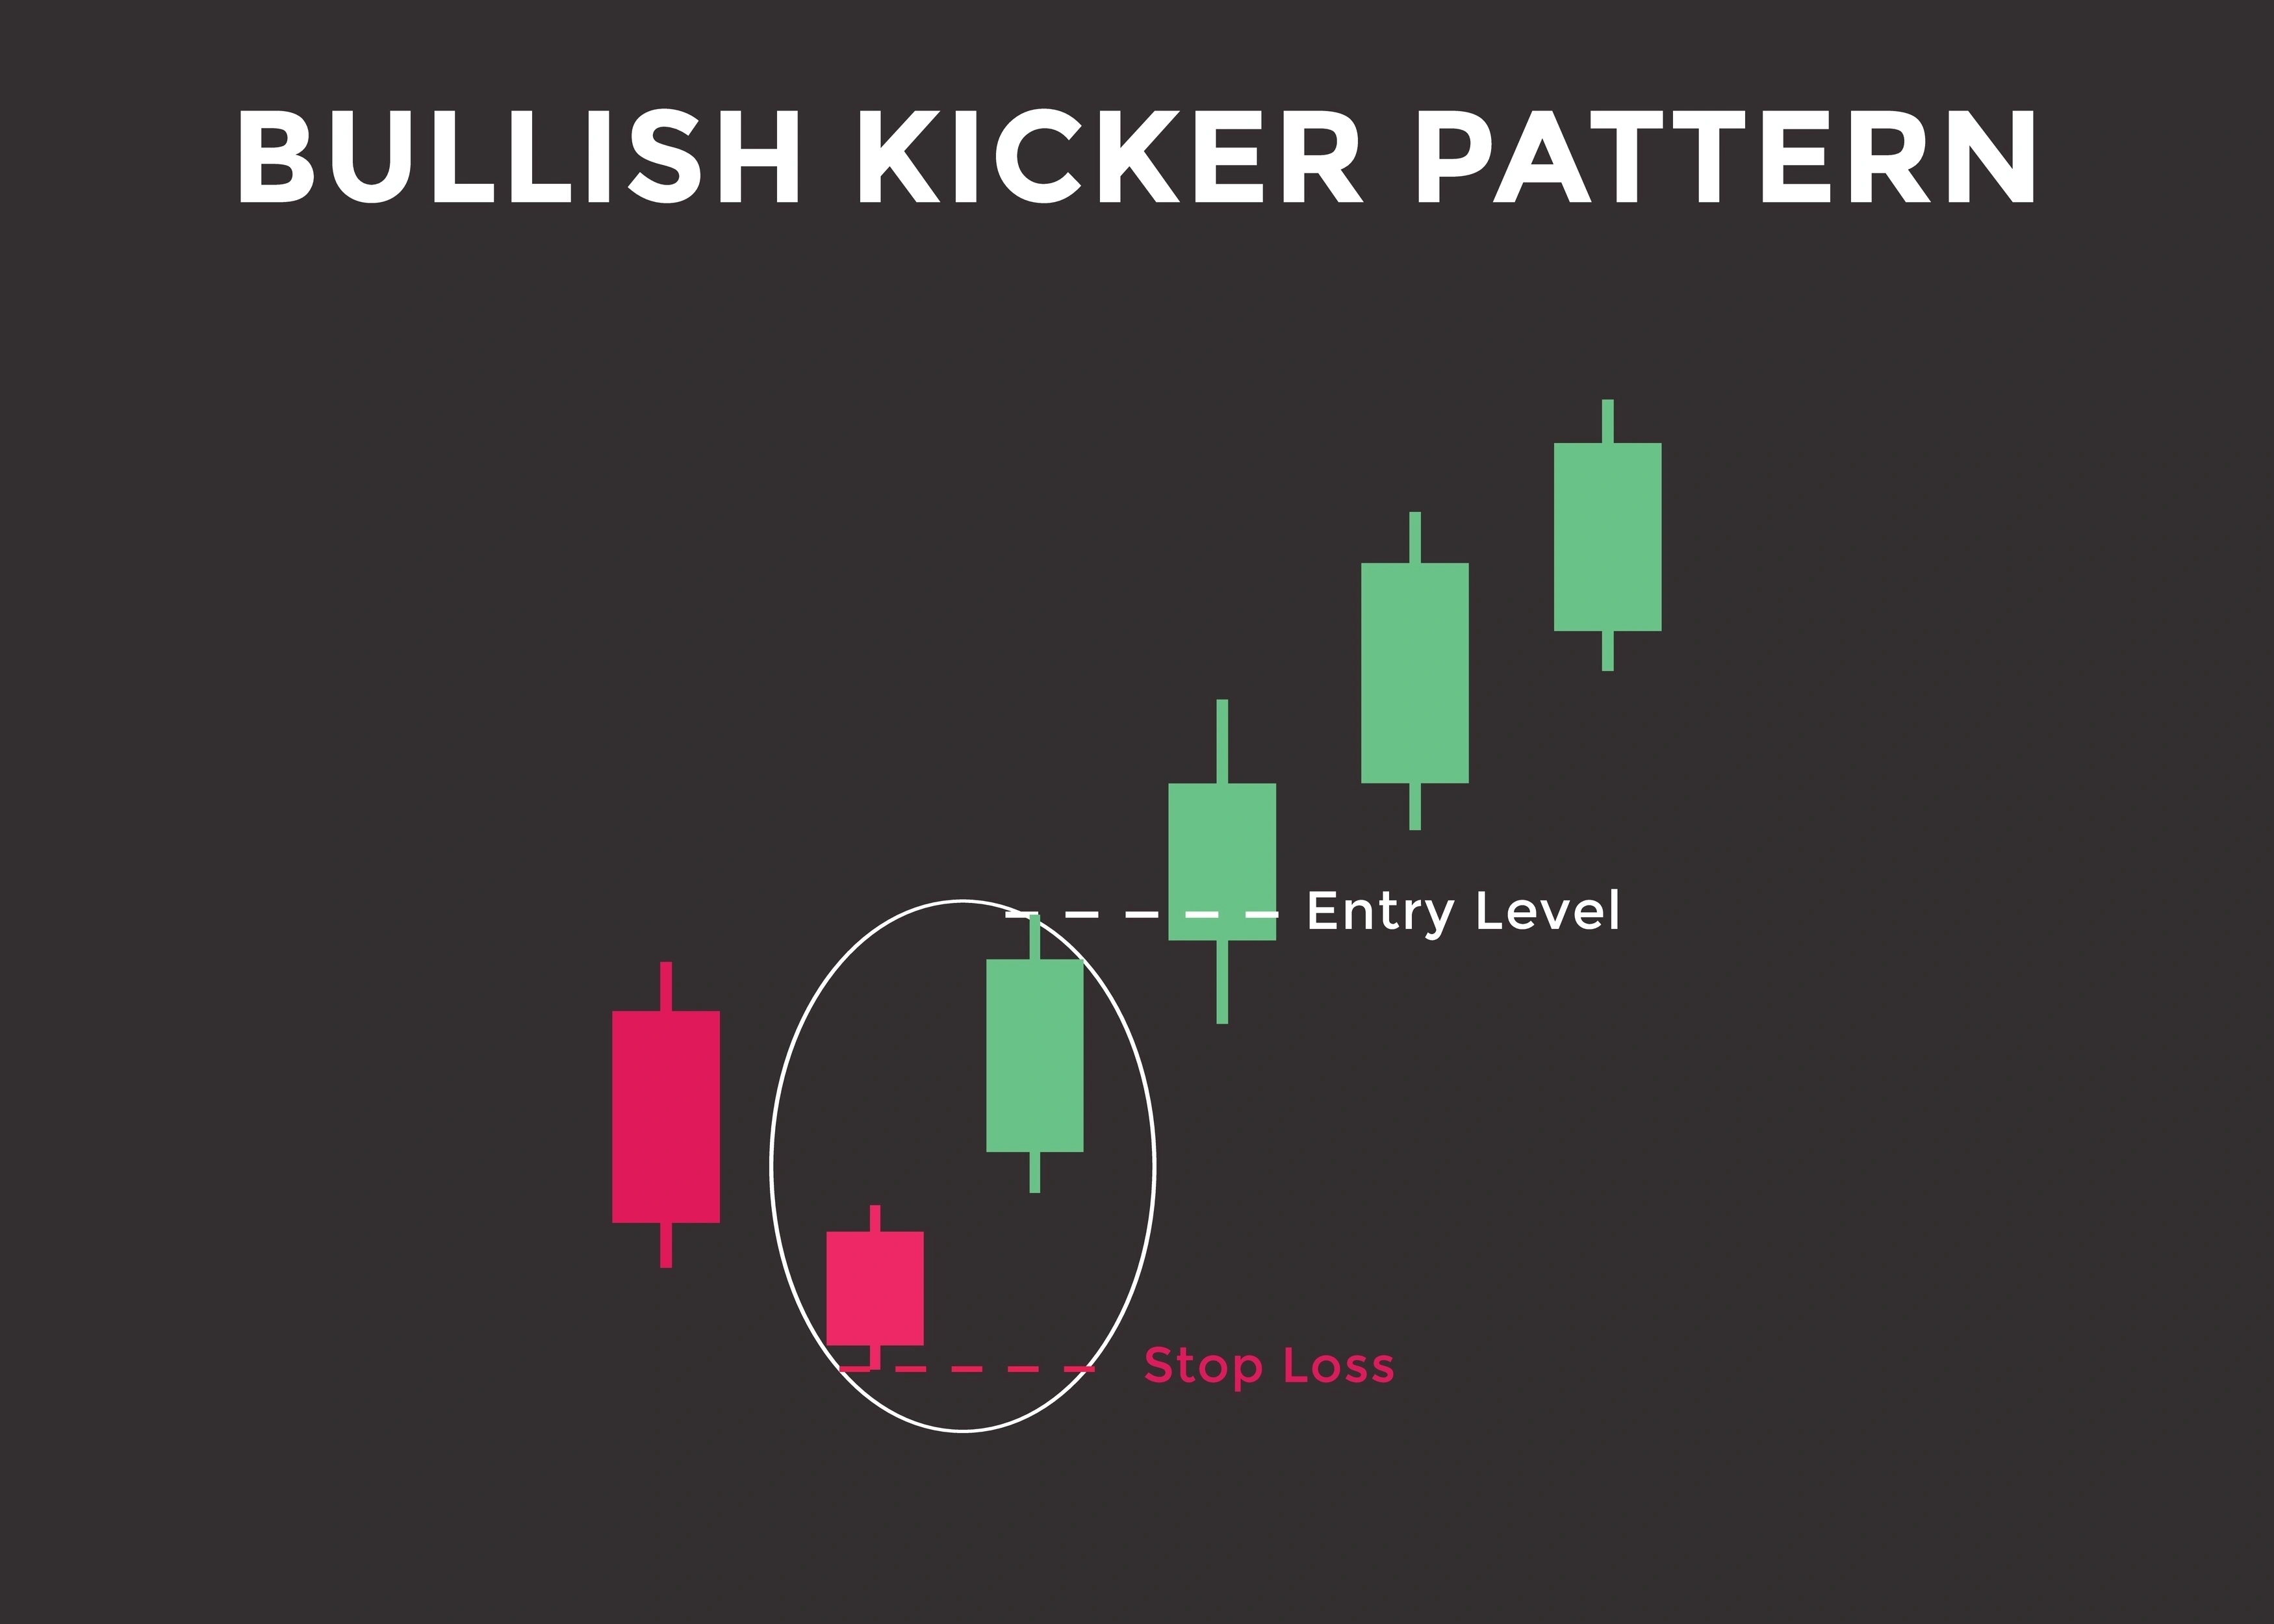
What it looks like: A red candle on Day 1. On Day 2, the stock gaps up massively—opening above the previous day's high—and forms a strong green candle. There is a visible empty space (gap) between the two candles.
The Psychology in NEPSE: This is the most powerful two-candle pattern, and it is almost always driven by fundamentals or major news. Did the company just propose a massive bonus dividend? Did the Electricity Regulatory Commission (ERC) approve a 1:1 right share for a hydropower company? The sudden gap-up traps all the short-term bears, forcing a massive upward rally as buyers rush to lock in their shares at the upper circuit.
Your Next Move: Jump in as soon as possible if the volume confirms the move. Bullish Kickers often lead to multi-day rallies. However, be cautious of trading in the secondary market without verifying the underlying news first!
Deep Dive: 👉 Learn how to ride the momentum of a Bullish Kicker here.