

One of the biggest mistakes a laganikarta can make during a NEPSE bull run is selling a great stock too early just because it had a couple of red days.
No stock goes straight up in a straight line forever. Markets need to breathe. Retail traders will naturally book short-term profits, causing minor dips. But how do you know if a dip is just a temporary "rest stop" or the beginning of a massive market crash?
You look for the Rising Three Methods.
Unlike all the other patterns we have covered so far, this is a bullish continuation pattern. It proves that a minor pullback is entirely healthy and that the smart money is preparing to push the stock to new, explosive highs.
What is the Rising Three Methods Pattern?
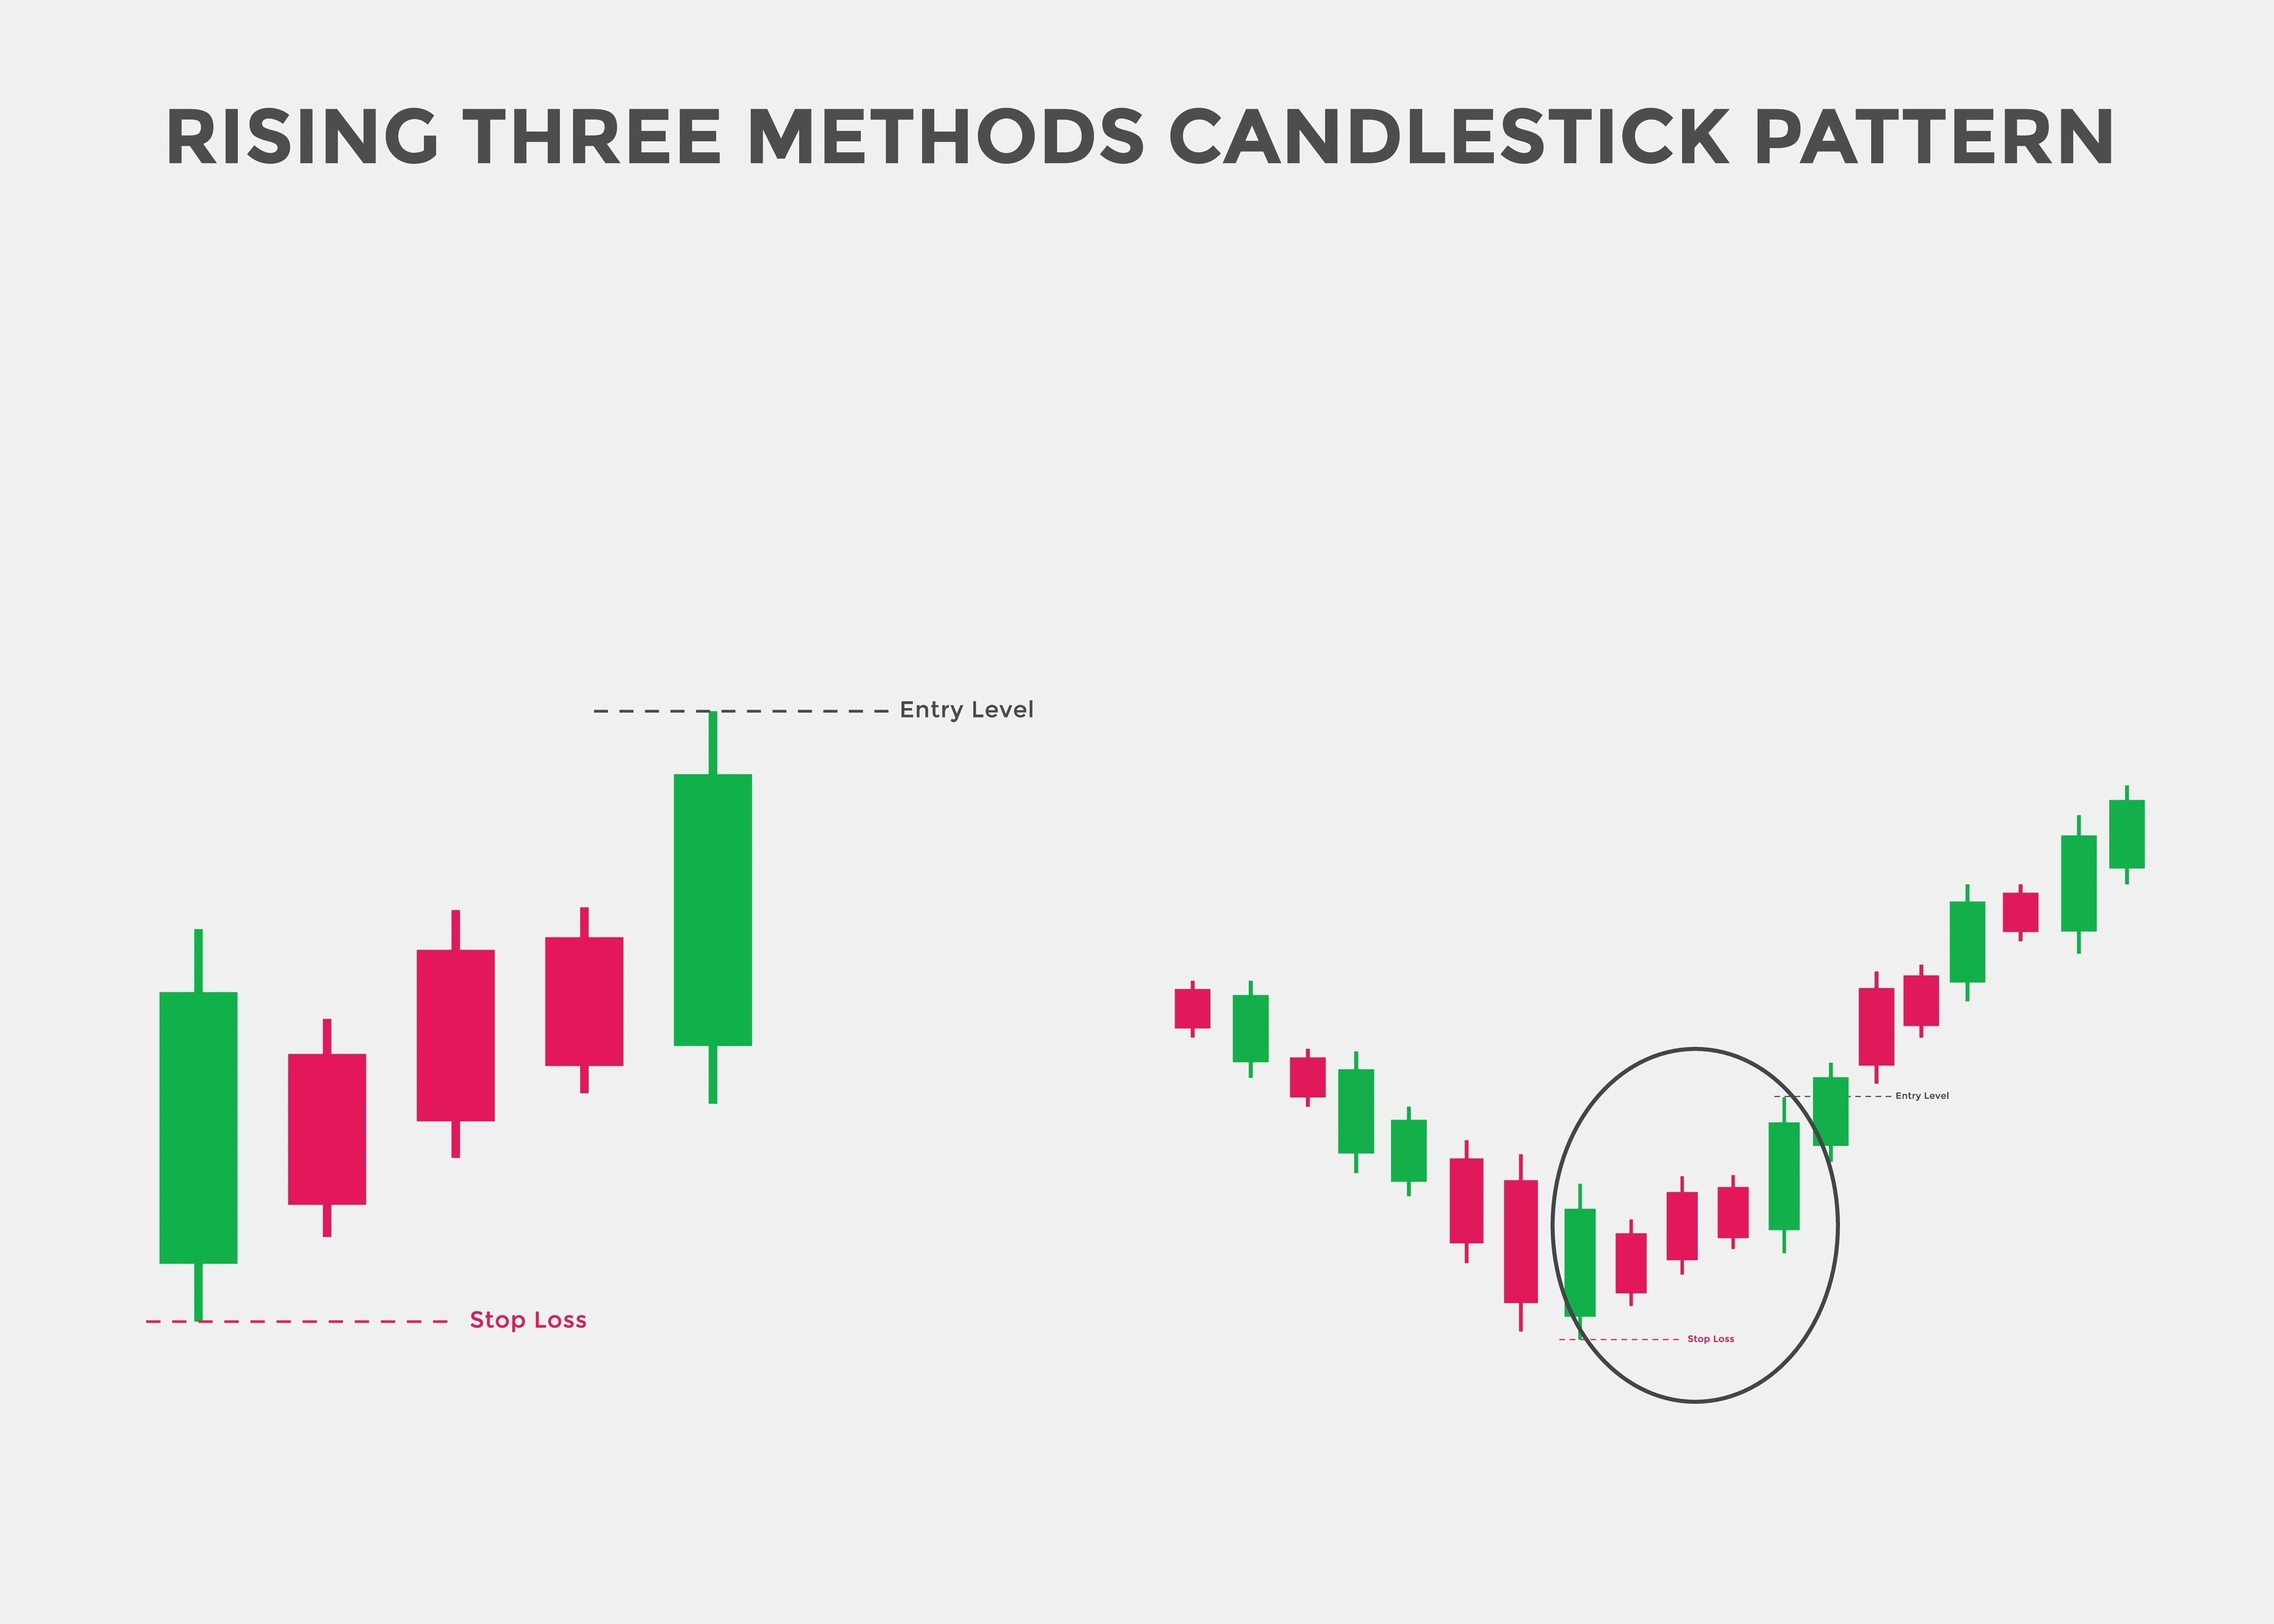
The Rising Three Methods unfolds over five trading days. It visually represents a massive surge, a brief period of profit-booking, and then a continuation of the upward rally.
 The Anatomy of a Perfect Rising Three Methods:
Candle 1 (Day 1): A long, strong green candle that aligns with the current ongoing uptrend.
Candles 2, 3, and 4 (The Rest Stop): A series of small-bodied, usually red candles that drift downward. Crucial Rule: All three of these small pullback candles must remain contained within the high and low range of the massive Day 1 green candle. They should not drop below Day 1's opening price.
Candle 5 (The Breakout): Another massive green candle that surges upward and closes above the high of the Day 1 candle, completely erasing the three days of minor red pullbacks.
The Psychology: Shaking Out the Weak Hands
This pattern is a masterclass in market manipulation and patience.
Let's say a major commercial bank stock surges 6% on Day 1 due to great fundamental news. Over the next three days (Days 2, 3, and 4), impatient retail traders who bought early decide to book their profits. The stock slowly drifts down 1% or 2% each day. Newer investors panic, thinking the rally is over, and sell their kitta at a loss. This is called "shaking out the weak hands."
However, notice what the kheladis (institutions) are doing. They are quietly buying up all those shares at a slight discount, refusing to let the price drop below the Day 1 support level. By Day 5, the selling pressure is completely exhausted. The big players step on the gas, creating a massive green candle that breaks new highs and leaves the panic-sellers behind.
How to Trade the Rising Three Methods in NEPSE
This pattern is incredibly powerful for adding to your existing positions (compounding) or jumping onto a trend you initially missed.
Step 1: Check the Overall Trend This pattern is completely useless in a downtrend. It must form in the middle of a confirmed, aggressive uptrend.
Step 2: Monitor the Volume (The Ultimate Tell) Volume is the key to trading this pattern in Nepal.
The volume on Day 1 (the big green candle) should be high.
The volume during Days 2, 3, and 4 (the red pullback candles) should be very low. This proves that the drop is just minor profit-taking, not institutional dumping.
The volume on Day 5 (the breakout candle) should spike massively again, confirming the trend is resuming.
Step 3: Execution & Risk Management
Entry: Buy near the close of Day 5, once it is obvious the price is breaking and closing above the Day 1 high.
Stop-Loss: Place your stop-loss just below the absolute low of the Day 1 green candle. If the price falls below that, the "rest stop" was actually a full trend reversal, and you must exit.
Congratulations! You Have Mastered NEPSE Candlestick Patterns!
You have officially completed our massive deep dive into NEPSE technical analysis. By understanding the psychology behind Single, Two, and Three+ Candle patterns, you are no longer trading blindly. You can now read the footprints of the kheladis, avoid fakeouts, and execute your trades with the confidence of a seasoned professional.
Happy Trading, and may your TMS dashboard always be green!