
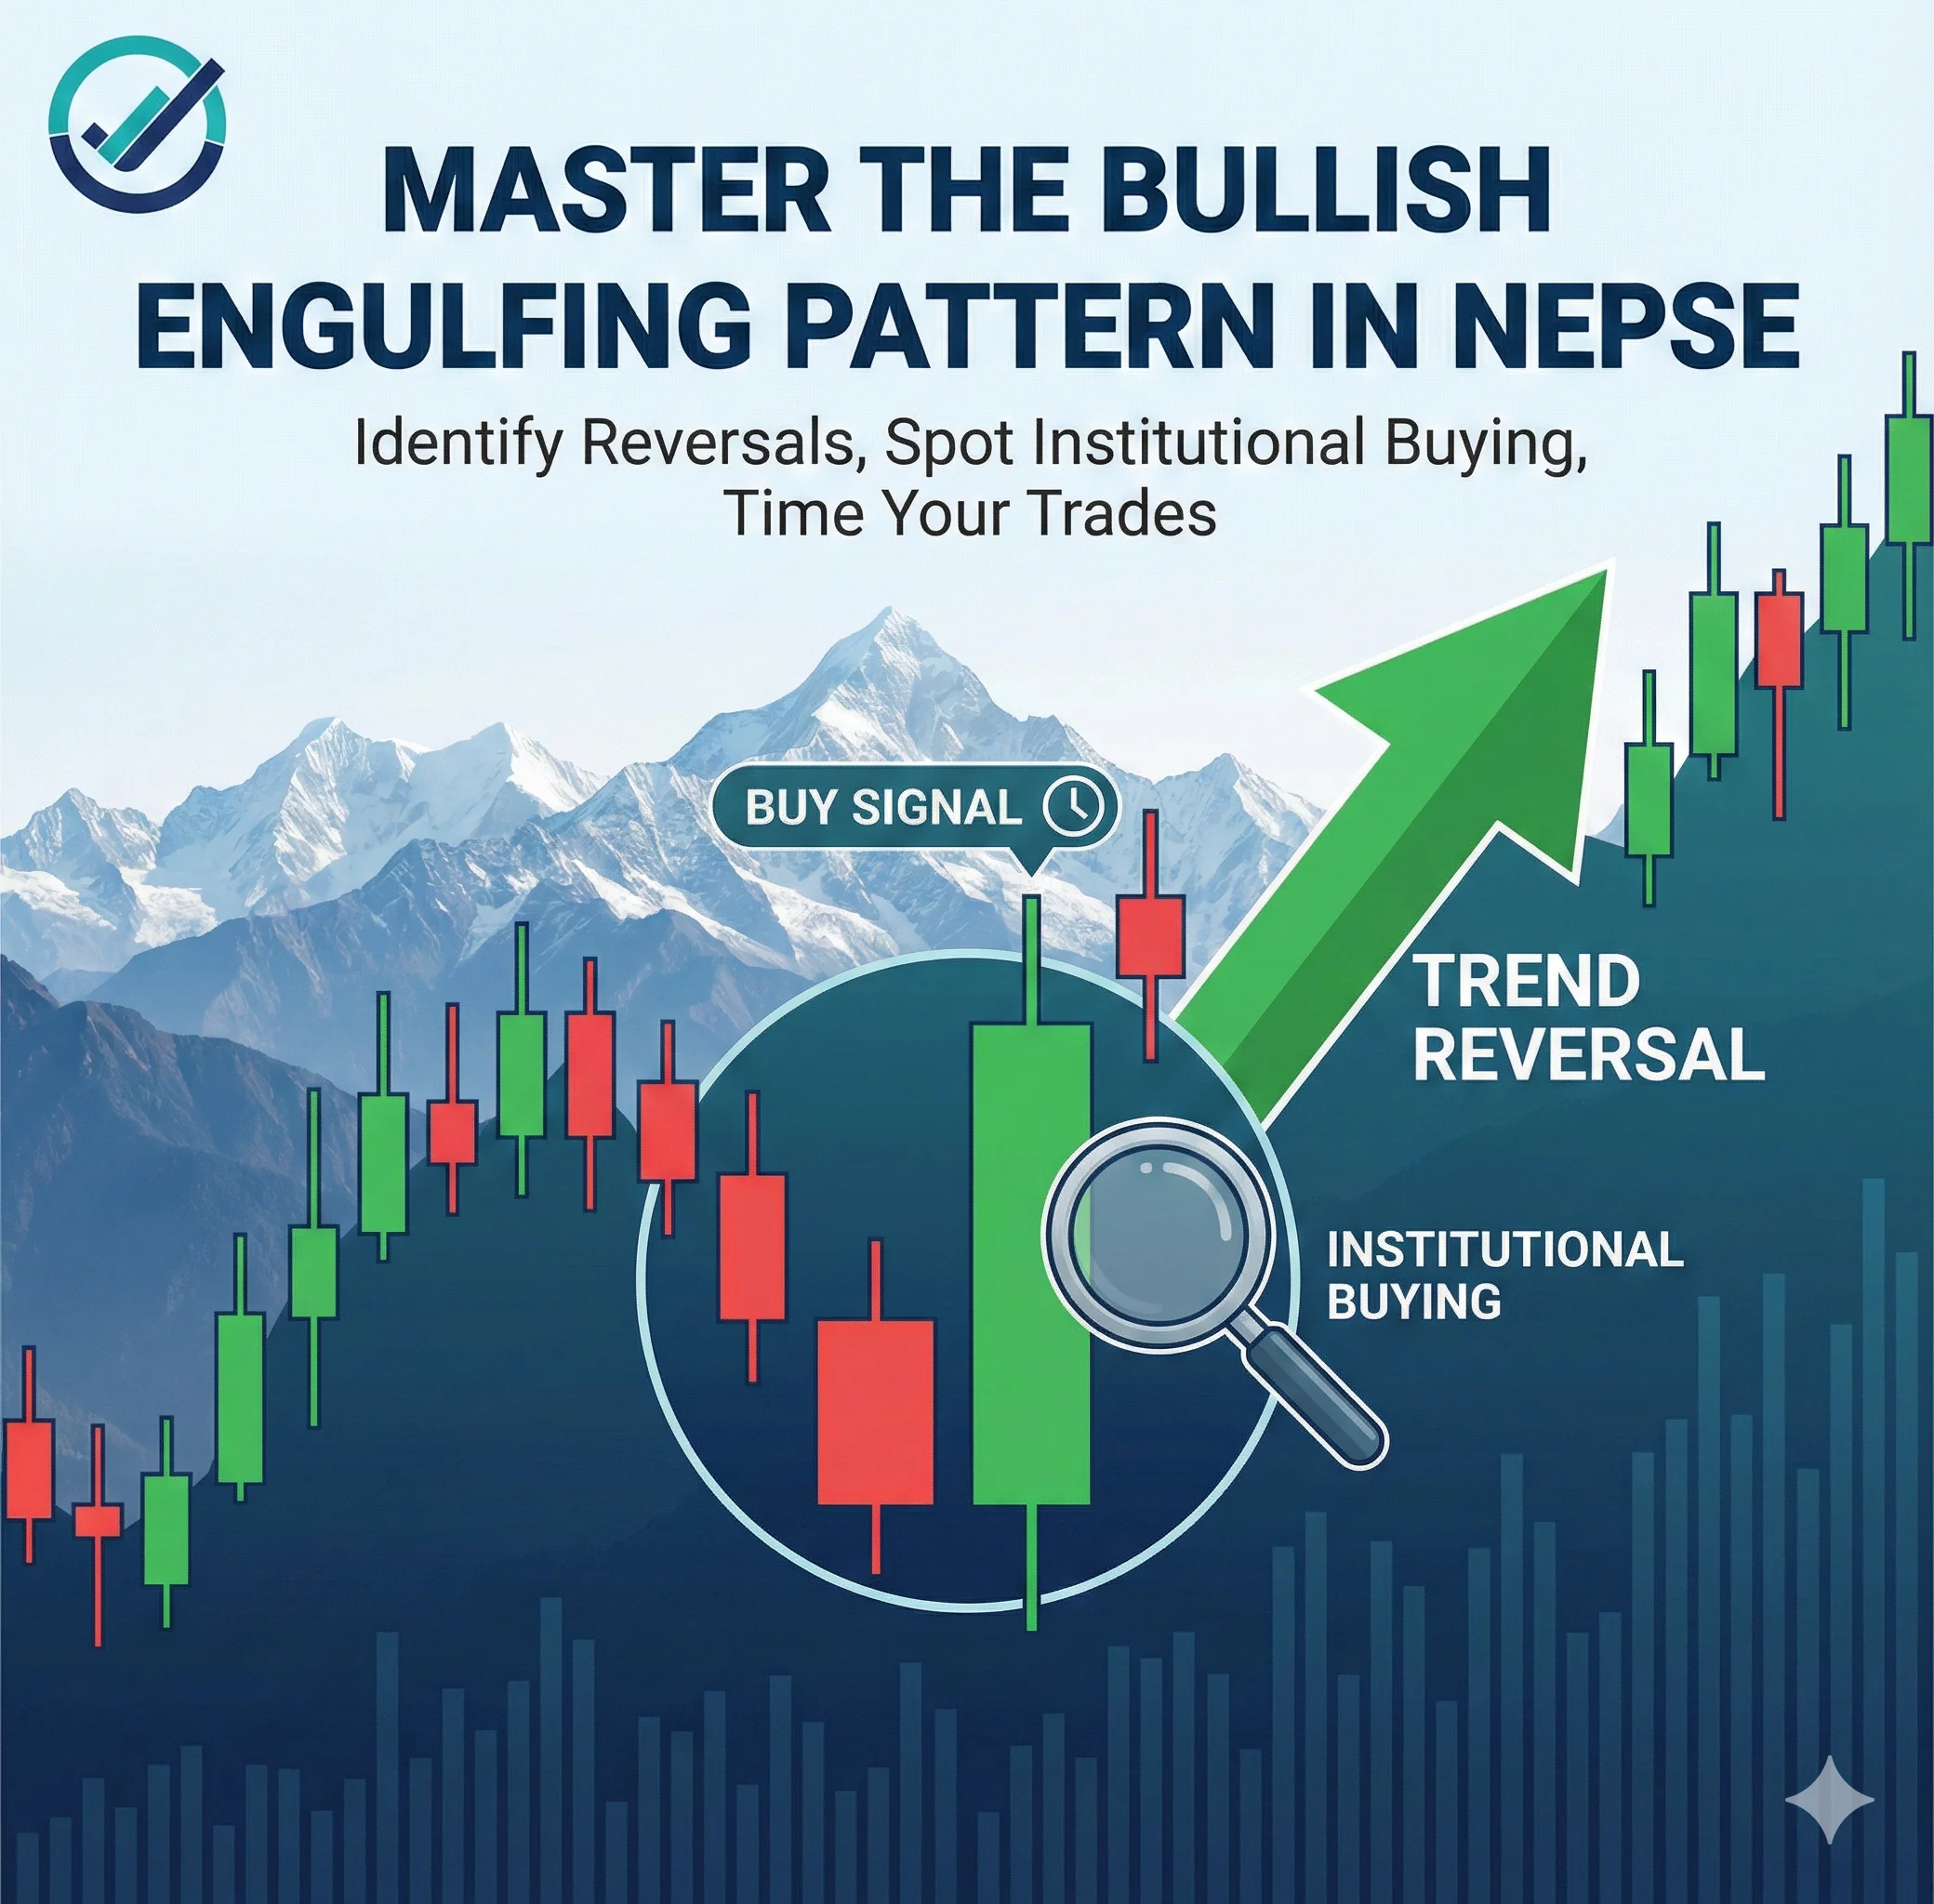
The Bullish Engulfing Pattern in NEPSE: Total Buyer Domination
In our previous guides, we discussed how single-day patterns like the Hammer and Inverted Hammer can help you spot the absolute bottom of a NEPSE crash. However, single-candle patterns can sometimes be risky—they show a brief moment of hope, but they require a lot of patience to confirm.
What if you want a stronger, more aggressive signal? What if you want to see proof on your TMS screen that the bears have been completely wiped out and the bulls have taken absolute control of the market?
Enter the Bullish Engulfing Pattern.
This two-candle formation is one of the most reliable and highly sought-after reversal signals in technical analysis. For Nepali laganikartas, it is a massive green flag indicating that "smart money" is aggressively accumulating kitta.
Here is everything you need to know about spotting, confirming, and trading the Bullish Engulfing pattern in the Nepali share market.
What is a Bullish Engulfing Pattern?
The Bullish Engulfing is a two-candlestick reversal pattern that forms at the bottom of a downtrend. Unlike single-candle patterns, this formation gives you a side-by-side comparison of the shifting momentum over two consecutive trading days.
 The Anatomy of a Perfect Bullish Engulfing:
Candle 1 (Day 1): A relatively small red (bearish) candle. This indicates that the sellers are still pushing the price down, but their momentum is starting to weaken.
Candle 2 (Day 2): A large green (bullish) candle. The opening price of this candle is usually lower than the previous day's close, but the buying pressure is so intense that the price shoots up and closes higher than the previous day's open.
The "Engulfing" Rule: The real body of the large green candle must completely cover (or "engulf") the real body of the previous day's red candle. While it's best if it engulfs the wicks too, strict technical analysts focus primarily on the real body.
The Psychology: What Does It Mean in NEPSE?
To understand the power of this pattern, let's look at the market psychology behind a typical banking or hydropower stock experiencing this setup.
The Final Drop (Day 1): The stock has been falling for days. Retail investors are exhausted and continue to sell off their holdings at a loss. A small red candle forms, showing the bears are still technically in charge, but the selling volume is drying up.
The Turnaround (Day 2 - 11:00 AM): The market opens, and the price might even gap down slightly in the pre-open session. It looks like another bleeding red day.
The Institutional Takeover (Day 2 - 11:15 AM to 3:00 PM): Suddenly, massive buy orders start hitting the market depth. The kheladis (institutional buyers and mutual funds) have decided the stock is severely undervalued. They buy aggressively, absorbing every single sell order. They push the price so high that it completely erases the losses of the previous day.
The message is clear: The bears tried to push the market lower, but the bulls responded with overwhelming force. It is a total shift in market sentiment.
How to Trade the Bullish Engulfing Pattern in NEPSE
Because this is a two-day pattern, the confirmation is practically built-in. However, you still need a solid trading plan to maximize your Risk-to-Reward ratio.
Step 1: Check the Trend and Location A Bullish Engulfing pattern found in the middle of a sideways (ranging) market is basically useless. It must appear after a clear, sustained downtrend. The setup is highly reliable if it forms near:
A major historical support level.
The lower band of the Bollinger Bands.
An upward-sloping trendline.
Step 2: Verify the Volume In the NEPSE, volume is your ultimate confirmation tool. Look at the volume bar for Day 2 (the large green candle). The trading volume on the engulfing day should be significantly higher than the volume on the red day. High turnover proves that big money is driving the reversal, not just a few retail traders.
Step 3: Execution & Risk Management
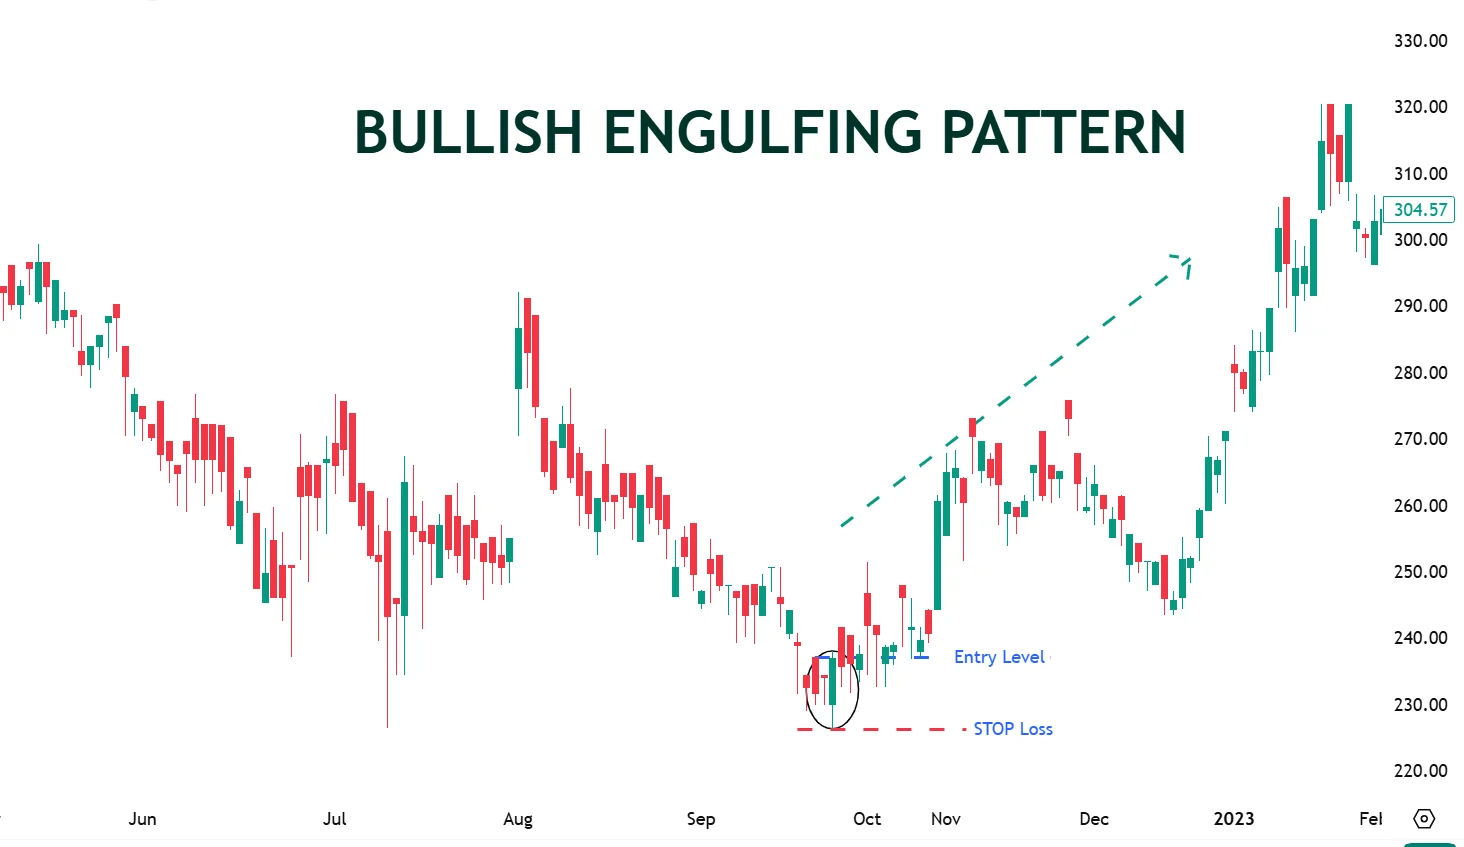
Entry: You have two options. Aggressive traders can buy near the market close (around 2:50 PM) on Day 2 if the engulfing pattern is clearly forming. Conservative traders should wait for Day 3 to open and buy if the price breaks slightly above the high of the green candle.
Stop-Loss: This is crucial. Place your stop-loss just a few rupees below the lowest point (the bottom wick) of the green engulfing candle. If the price drops below this level, the bullish thesis is invalidated.
Target: Look for the next major swing high or resistance level on your chart. Aim for a minimum Risk-to-Reward ratio of 1:2.
The Trap: Avoiding "Mid-Trend" Fakeouts
The most common mistake traders make in the secondary market is spotting an engulfing candle in the middle of an uptrend and assuming it's a signal to buy more. A Bullish Engulfing is a reversal pattern, not a continuation pattern. If you see it at the top of a rally or during a random sideways chop, ignore it.
Always rely on context: Where the pattern forms on the chart is just as important as the pattern itself.
Ready to explore more two-candle setups? What happens when the market crashes hard, but the buyers stage a massive intraday comeback that pierces right through the bears' defenses? 👉 Read our complete guide to the Piercing Line Candlestick Pattern here!