

The Bullish Harami in NEPSE: Spotting the End of a Downtrend
Some candlestick patterns, like the Bullish Engulfing, are aggressive and loud—they scream that the buyers have taken over. But sometimes, a market reversal in the NEPSE starts with a whisper.
Before the bulls can start a massive rally, the bears simply have to stop selling. This quiet, sudden halt in downward momentum is perfectly captured by the Bullish Harami pattern.
Derived from the old Japanese word for "pregnant," the Harami is an early warning system. It tells a laganikarta that the downtrend is running out of steam and a reversal is brewing. Here is how to trade this subtle but effective pattern in Nepal.
What is a Bullish Harami Pattern?
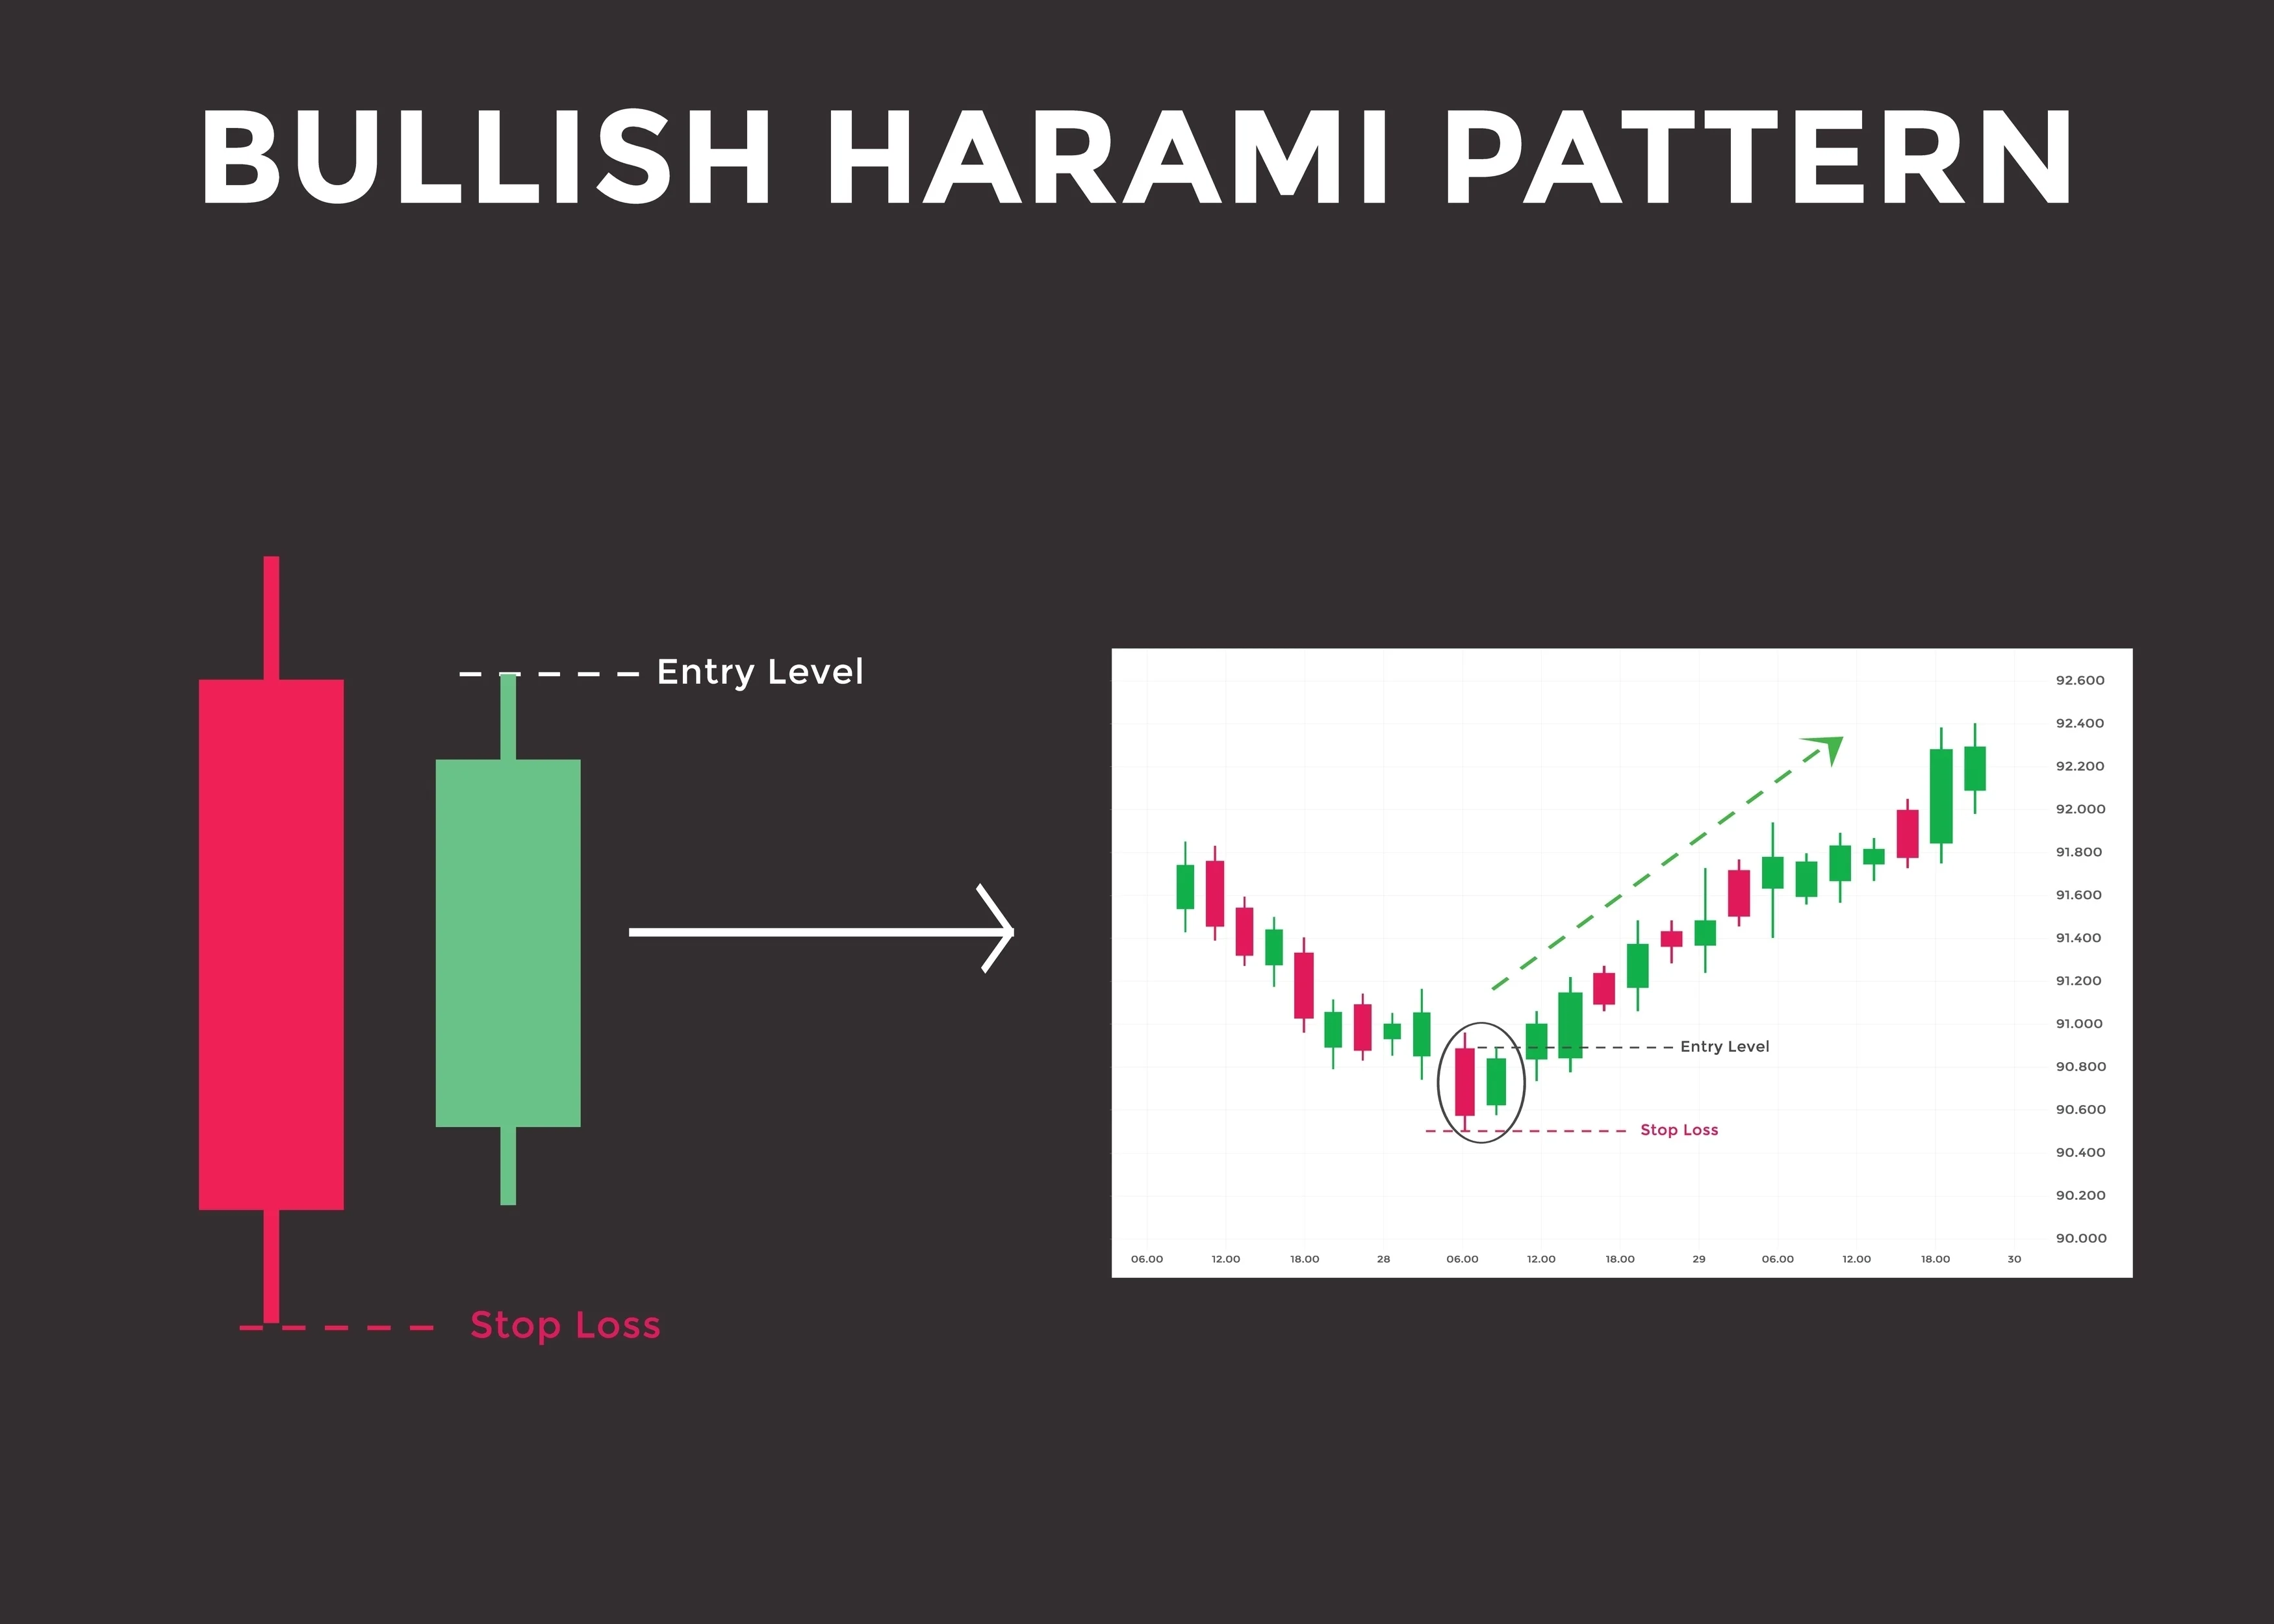
The Bullish Harami is a two-candle formation found at the bottom of a downtrend. It is essentially an "inside bar" setup, where the second day's price action is entirely trapped within the previous day's range.
 The Anatomy of a Perfect Bullish Harami:
Candle 1 (The "Mother" Candle): A large, long red candle. This shows that the sellers were still fully dominating the market on Day 1.
Candle 2 (The "Baby" Candle): A small green (or sometimes red/doji) candle. The critical rule is that the entire real body of this small candle must fit completely inside the real body of Day 1's red candle.
The Psychology: The Bears Run Out of Steam
Why does a small candle inside a large candle signal a reversal in the NEPSE? It all comes down to a loss of momentum.
Imagine a bearish phase where a stock drops 3% to 5% every day. The sellers are aggressive. Then, on Day 2 of the Harami pattern, the market opens slightly higher than yesterday's close (a gap up). The sellers try to push the price down to make a new low, but they fail. The buyers try to push the price up to make a new high, but they also fail.
The result is a small, tight trading range. The selling pressure has suddenly evaporated. The kheladis have stopped dumping their shares, and the market is taking a breath. The trend has paused, which is the first step toward a reversal.
How to Trade the Bullish Harami in NEPSE
Because the Bullish Harami represents a "pause" rather than an aggressive "attack" by the buyers, it is considered a slightly weaker signal than an Engulfing pattern. Therefore, confirmation is mandatory.
Step 1: Look for Volume Contraction and Expansion In a perfect Harami setup, the trading volume on Day 1 (the big red candle) will be high, while the volume on Day 2 (the small inside candle) will drop significantly. This proves the sellers have lost interest.
Step 2: Wait for the Breakout (Day 3) Do not buy the stock on Day 2! You must wait for the market structure to break. Wait for Day 3. If Day 3 is a strong green candle that breaks and closes above the high of the Day 1 red candle, the reversal is officially confirmed (this confirmed three-day pattern is actually called the Three Inside Up).
Step 3: Execution & Stop-Loss
Entry: Buy on Day 3 once the price breaks above the high of the Day 1 "Mother" candle.
Stop-Loss: Place your stop-loss just below the low of the Day 1 red candle. If the price breaks down below that level, the downtrend is resuming.