
The Tweezer Bottom Pattern in NEPSE: The Double Test of Support
When the NEPSE index is falling, finding a safe place to invest your capital can feel like guessing. You might buy a stock thinking it has reached the bottom, only for it to drop another 5% the very next day.
To avoid catching a falling knife, you need proof that buyers are actively defending a specific price point. One of the best visual confirmations of a "concrete floor" in the market is the Tweezer Bottom Pattern.
This two-candle formation shows a clear tug-of-war where the sellers try their hardest to crash the price, but the buyers stubbornly refuse to let it drop below a certain level. Here is how to use the Tweezer Bottom to find low-risk, high-reward entries in the Nepali share market.
What is a Tweezer Bottom Pattern?
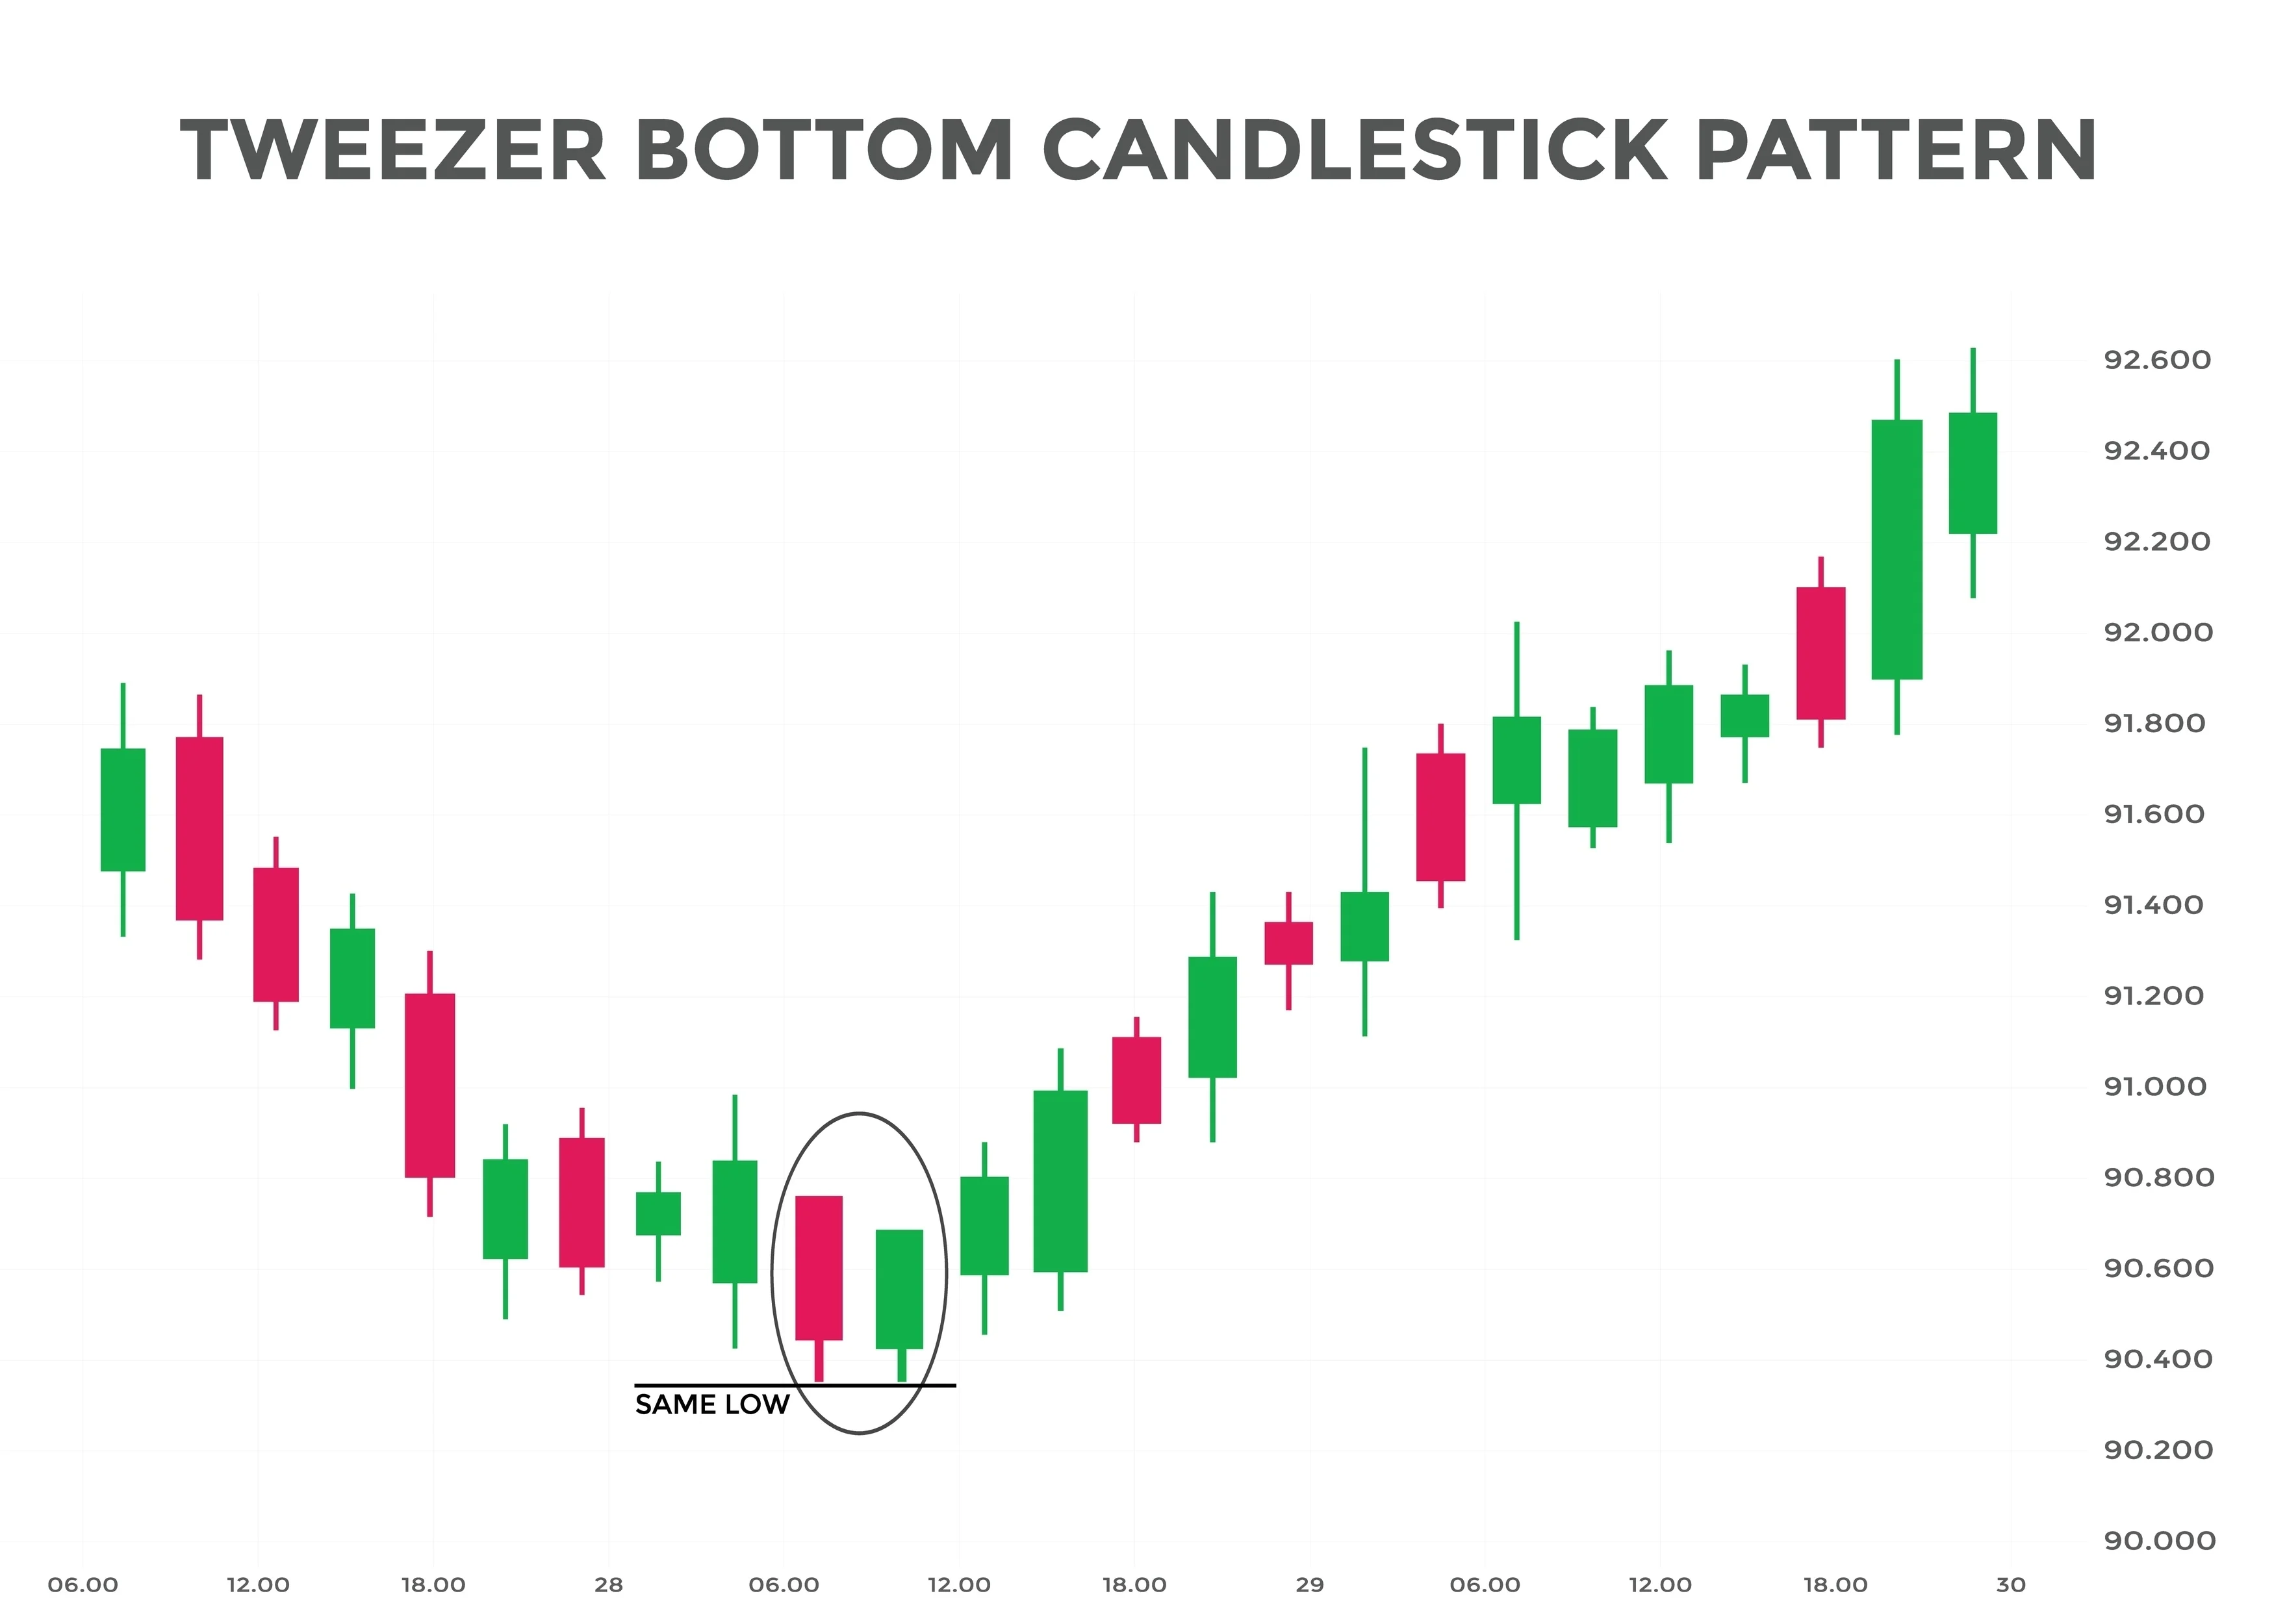
A Tweezer Bottom is a bullish reversal pattern that occurs at the end of a downtrend. It gets its name because the bottom of the two candlesticks aligns almost perfectly, resembling the tips of a pair of tweezers.
 The Anatomy of a Perfect Tweezer Bottom:
Candle 1 (Day 1): A bearish (red) candle that aligns with the ongoing downtrend.
Candle 2 (Day 2): A bullish (green) candle.
The Golden Rule: The most critical feature is that both candles must have identical, or nearly identical, lows. This could mean their lower wicks (shadows) end at the exact same price, or if they don't have lower wicks, their flat bottoms align perfectly.
The Psychology: Building a Concrete Floor
To understand why this pattern works, let's look at the psychology of the kheladis (big players) and retail investors over two trading days.
The First Attack (Day 1): The market is bearish. Sellers push the price down to a specific level (let's say exactly Rs. 450). At this point, smart money steps in, seeing value, and prevents the price from falling any further.
The Second Attack (Day 2): The next day, sellers try again. They dump their kitta and manage to push the price right back down to Rs. 450. However, the buyers are waiting. They defend that exact same price point again, absorbing all the supply and pushing the market to close in the green.
The message here is profound: Rs. 450 is a rock-solid support zone. The sellers tested it twice and failed both times. The downward momentum is exhausted, and the bulls are preparing to take control.
How to Trade the Tweezer Bottom in NEPSE
The Tweezer Bottom offers one of the best Risk-to-Reward ratios in technical analysis because your stop-loss level is crystal clear.
Step 1: Identify the Context The pattern is only valid if it forms after a clear downtrend. It becomes a highly actionable signal if the matching lows perfectly touch:
A historical support line on the NEPSE chart.
A major Fibonacci retracement level (like the 61.8% or 50% level).
An upward-sloping trendline.
Step 2: Wait for the Breakout Do not blindly buy just because the bottoms match. You need confirmation. Wait for the third day (Candle 3). If the price breaks above the high of the Day 2 green candle, the reversal is confirmed.
Step 3: Execution & Risk Management
Entry: Buy immediately when the price breaks above the high of the Day 2 candle.
Stop-Loss: Place your strict stop-loss just one or two rupees below the matching "tweezer" lows. If the price breaks below that concrete floor, the pattern is completely invalidated, and you must exit to protect your capital.