
Single-Candle Bullish Patterns in NEPSE
Any seasoned laganikarta (investor) knows that timing the NEPSE can sometimes feel like trying to catch a falling knife. When the market is bleeding red and panic selling hits the TMS, how do you spot the exact moment the smart money—or the kheladis—starts buying the dip? That’s where Single-Candle Bullish Patterns come into play.
In the Nepali share market, waiting for days to confirm a trend often means you've already missed the best entry price. Single-candle formations are your earliest, most raw signals that a downtrend is exhausting itself and a bullish reversal is about to kick in. By mastering these one-day signals, you can secure your kitta (shares) at crucial support zones before the rest of the retail crowd catches on.
In this guide, we are going to break down exactly when these patterns appear, what your immediate preparation should be, and the exact moment to execute your buy order. We will be covering the four most reliable single-candle setups for the NEPSE:
1. The Hammer: The Ultimate Bottom Rejection
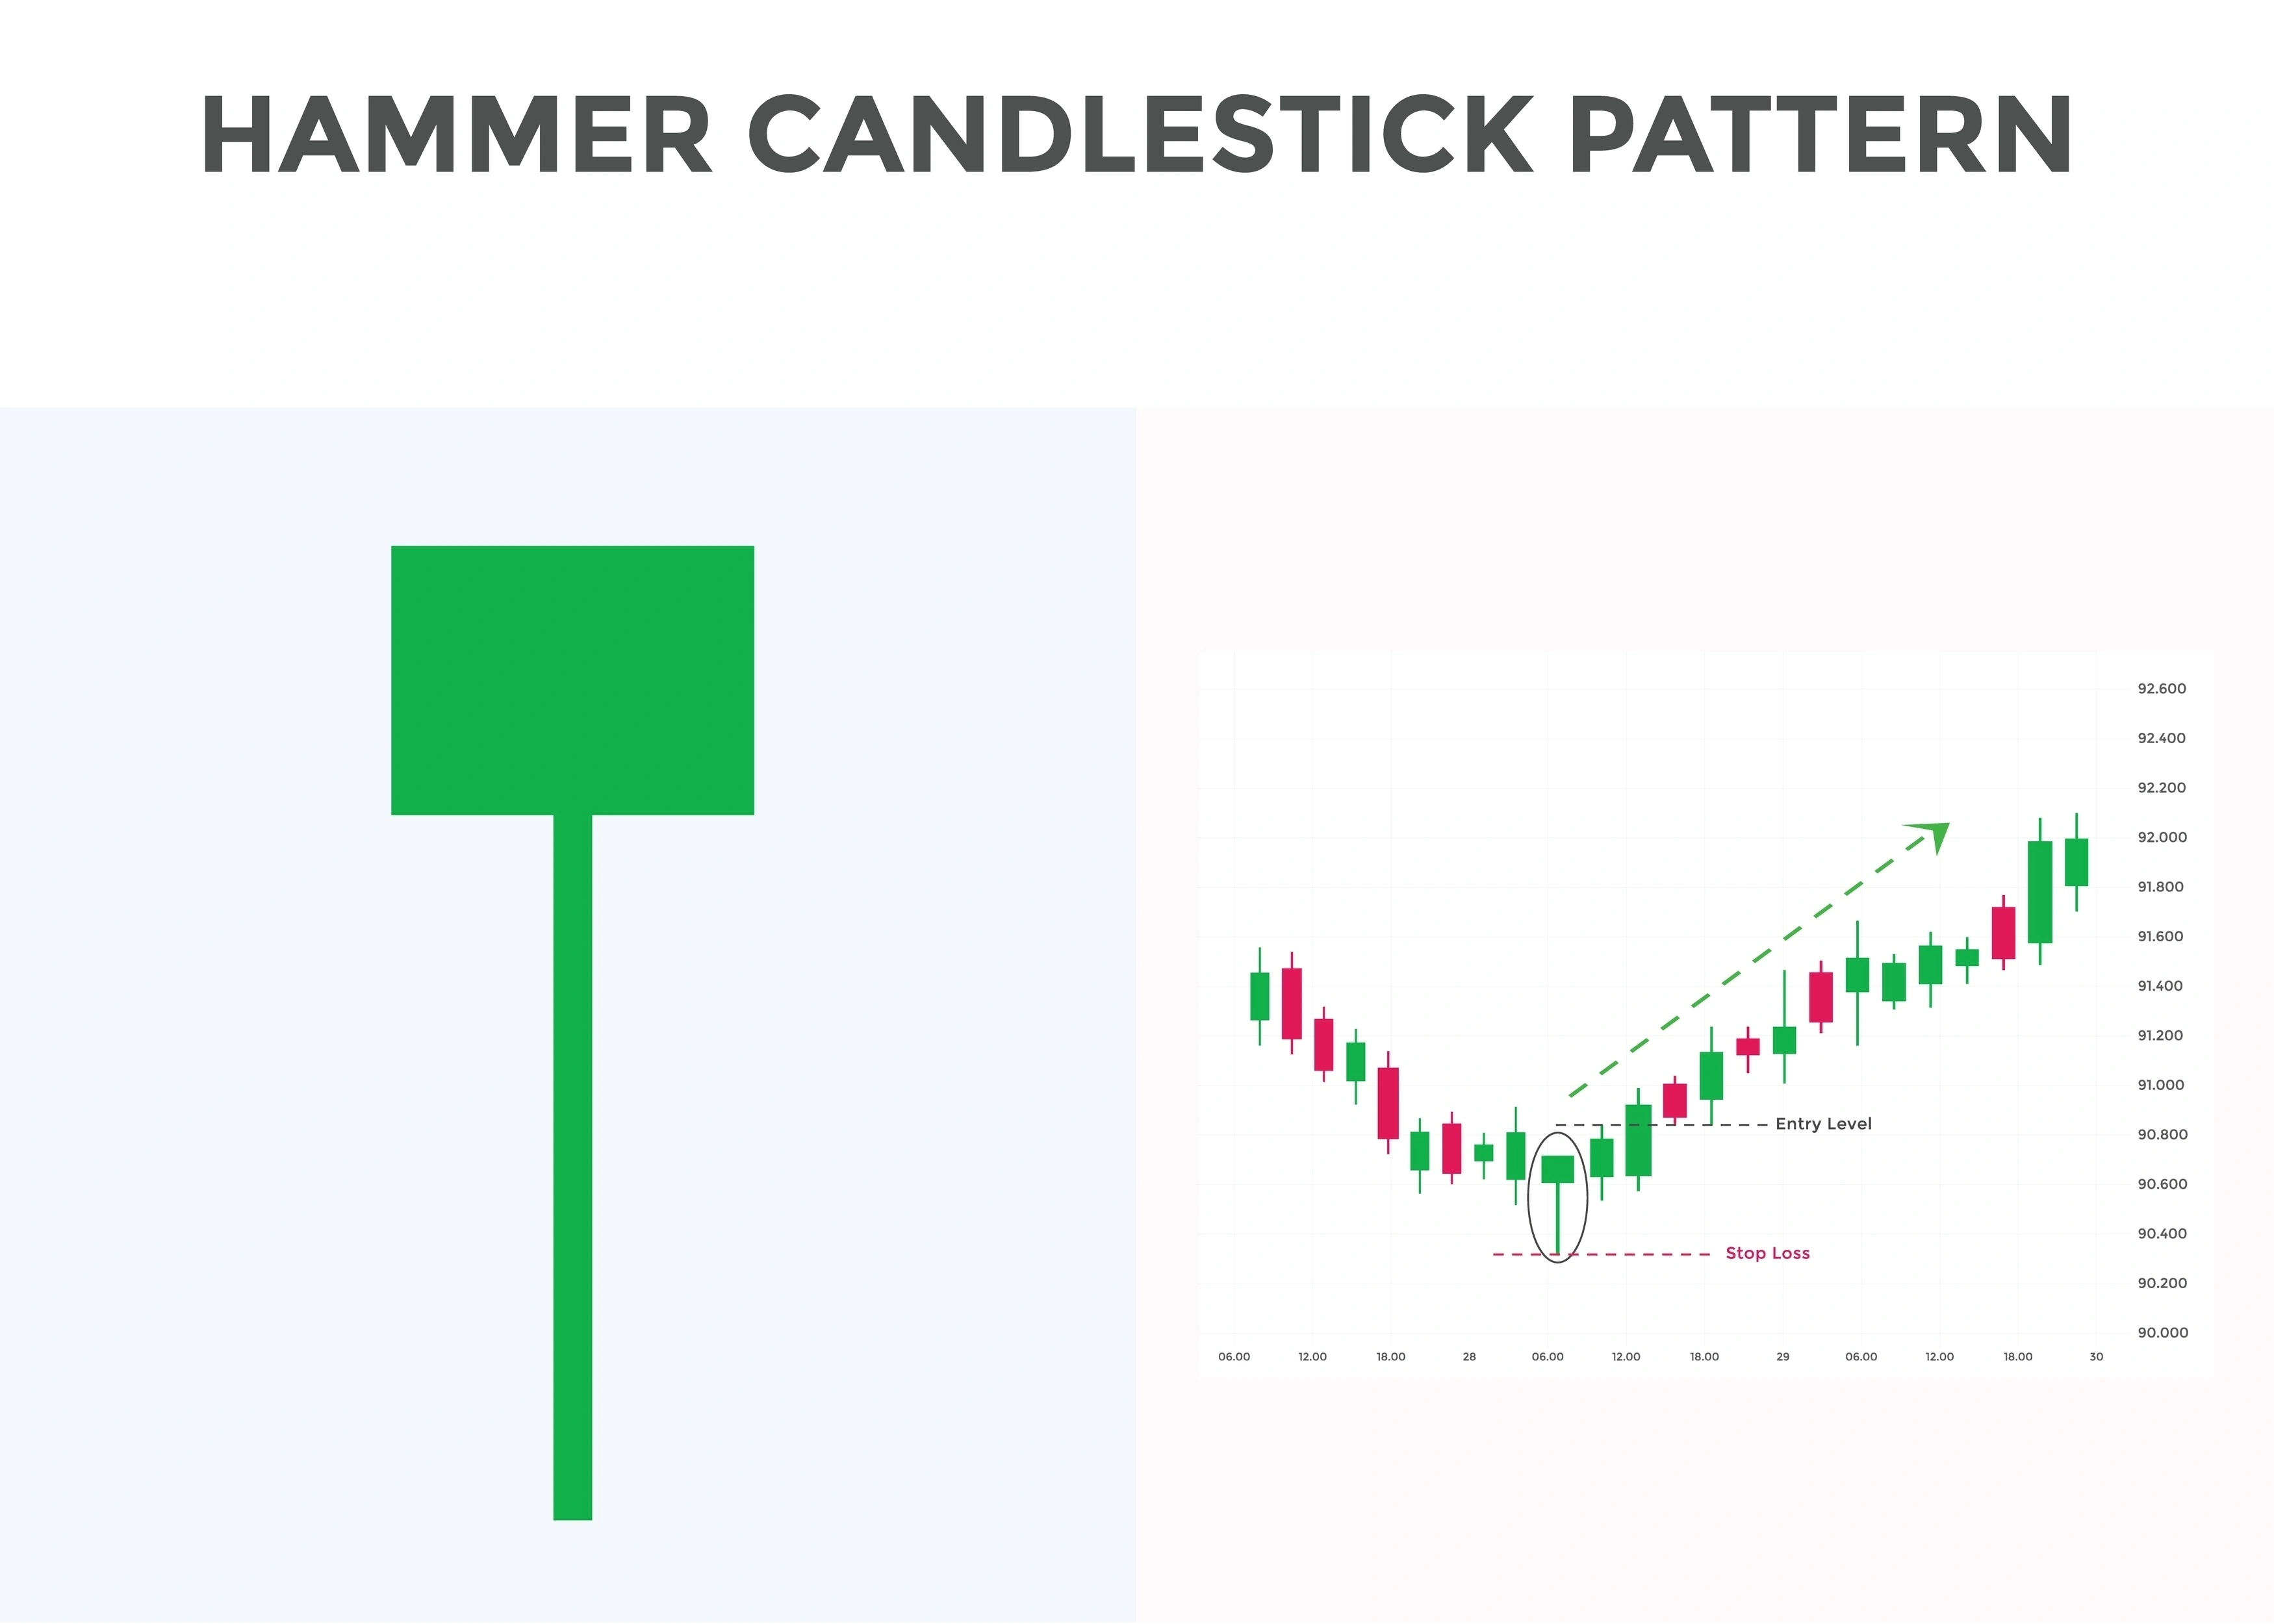 What it looks like: A small green or red body at the top of the daily range, with a long lower shadow (wick) that is at least twice the length of the body. There is little to no upper shadow.
The Psychology in NEPSE: Imagine the market opens and panic sellers immediately dump their shares, driving the price down sharply in the TMS. However, as the price hits a strong support zone, the smart money steps in. Buyers aggressively absorb all the selling pressure and push the price all the way back up to close near the open. It’s a clear signal that the bears are exhausted.
Your Next Move: Do not buy immediately just because you see a Hammer. Add the stock to your watchlist and wait for confirmation. You want to see the next day's candle close green and higher than the Hammer's body. Once confirmed, you can execute your buy order with a stop-loss just below the Hammer's lowest wick.
Deep Dive: 👉 Read our complete strategy guide on trading the Hammer Candlestick in NEPSE here.
2. The Inverted Hammer: The Bulls Are Testing the Waters
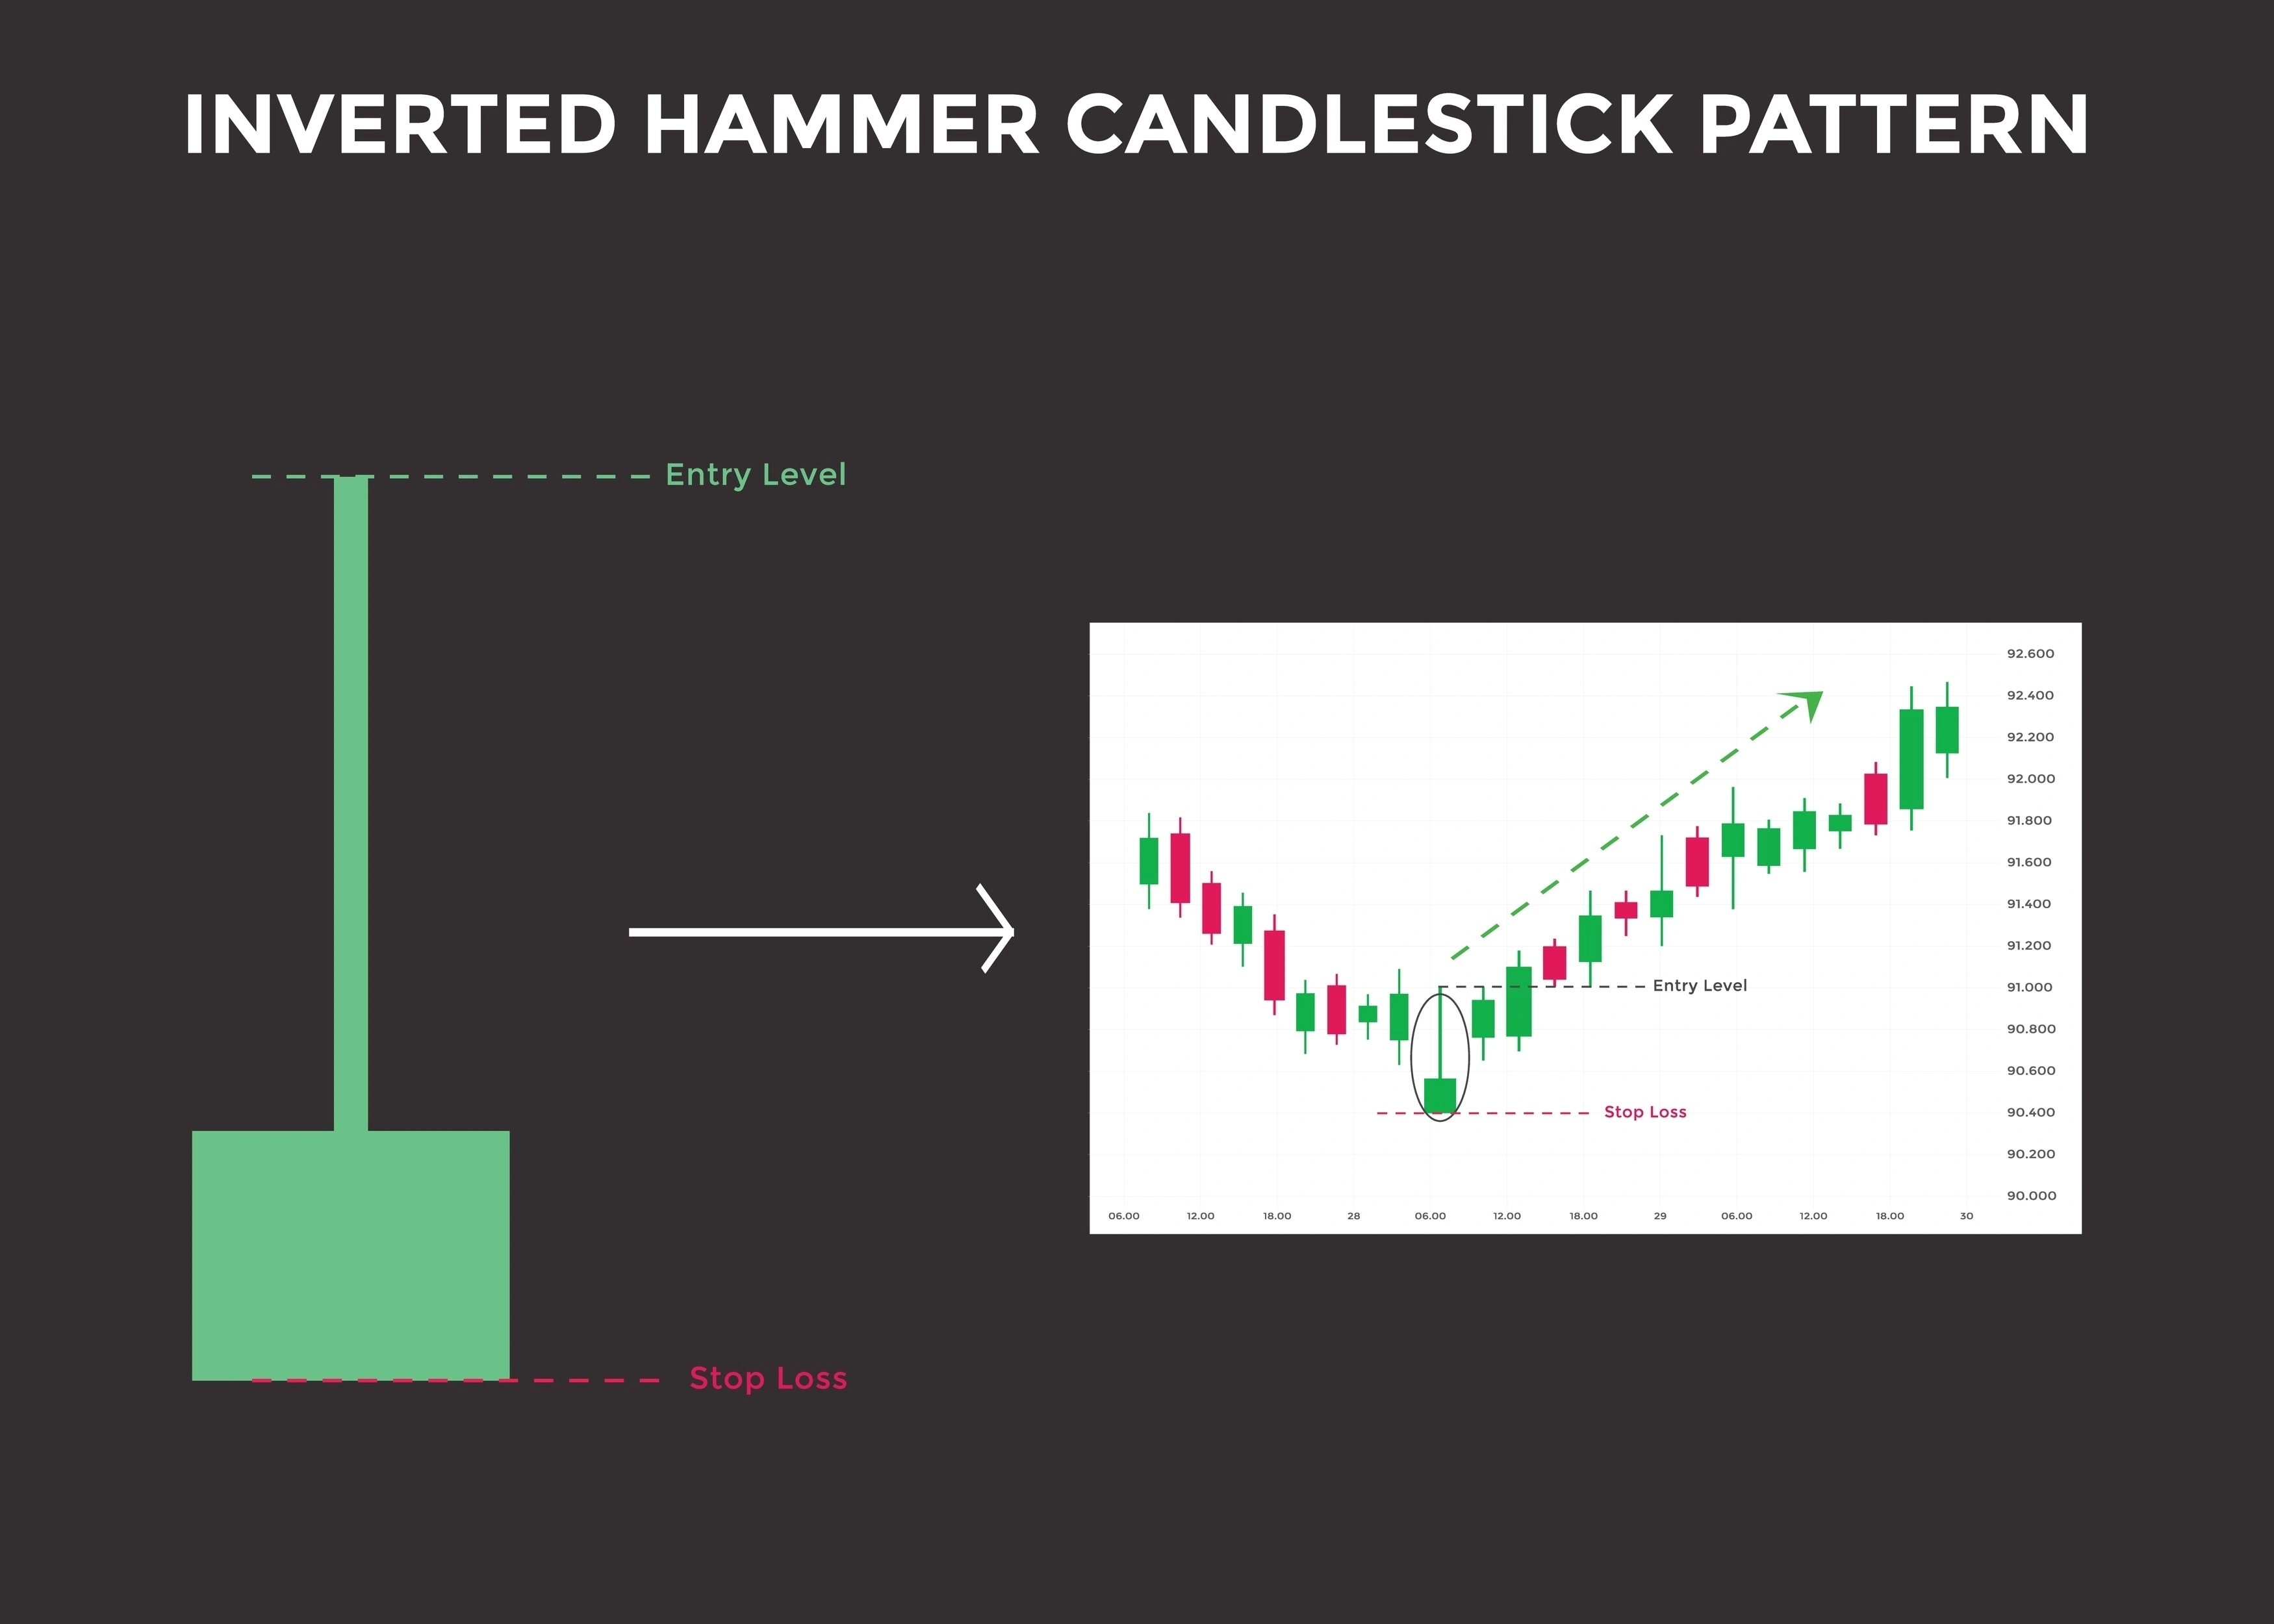 What it looks like: A small body at the bottom of the daily range, with a long upper shadow. Like the standard Hammer, it appears after a sustained downtrend.
The Psychology in NEPSE: In this scenario, buyers attempt to push the market up early in the trading session. The bears fight back and manage to close the price near the open. While it might look a bit weak because the price fell back down, the real takeaway is that buyers are finally showing up. The selling momentum is drying up, and the bulls are testing the resistance.
Your Next Move: Because the bears still showed some strength at the end of the day, confirmation is absolutely critical here. Watch the volume the next day. If the stock gaps up or forms a strong green candle with high turnover, the reversal is confirmed.
Deep Dive: 👉 Learn exactly how to spot and trade the Inverted Hammer here.
3. The Dragonfly Doji: The Rare Trend Reverser
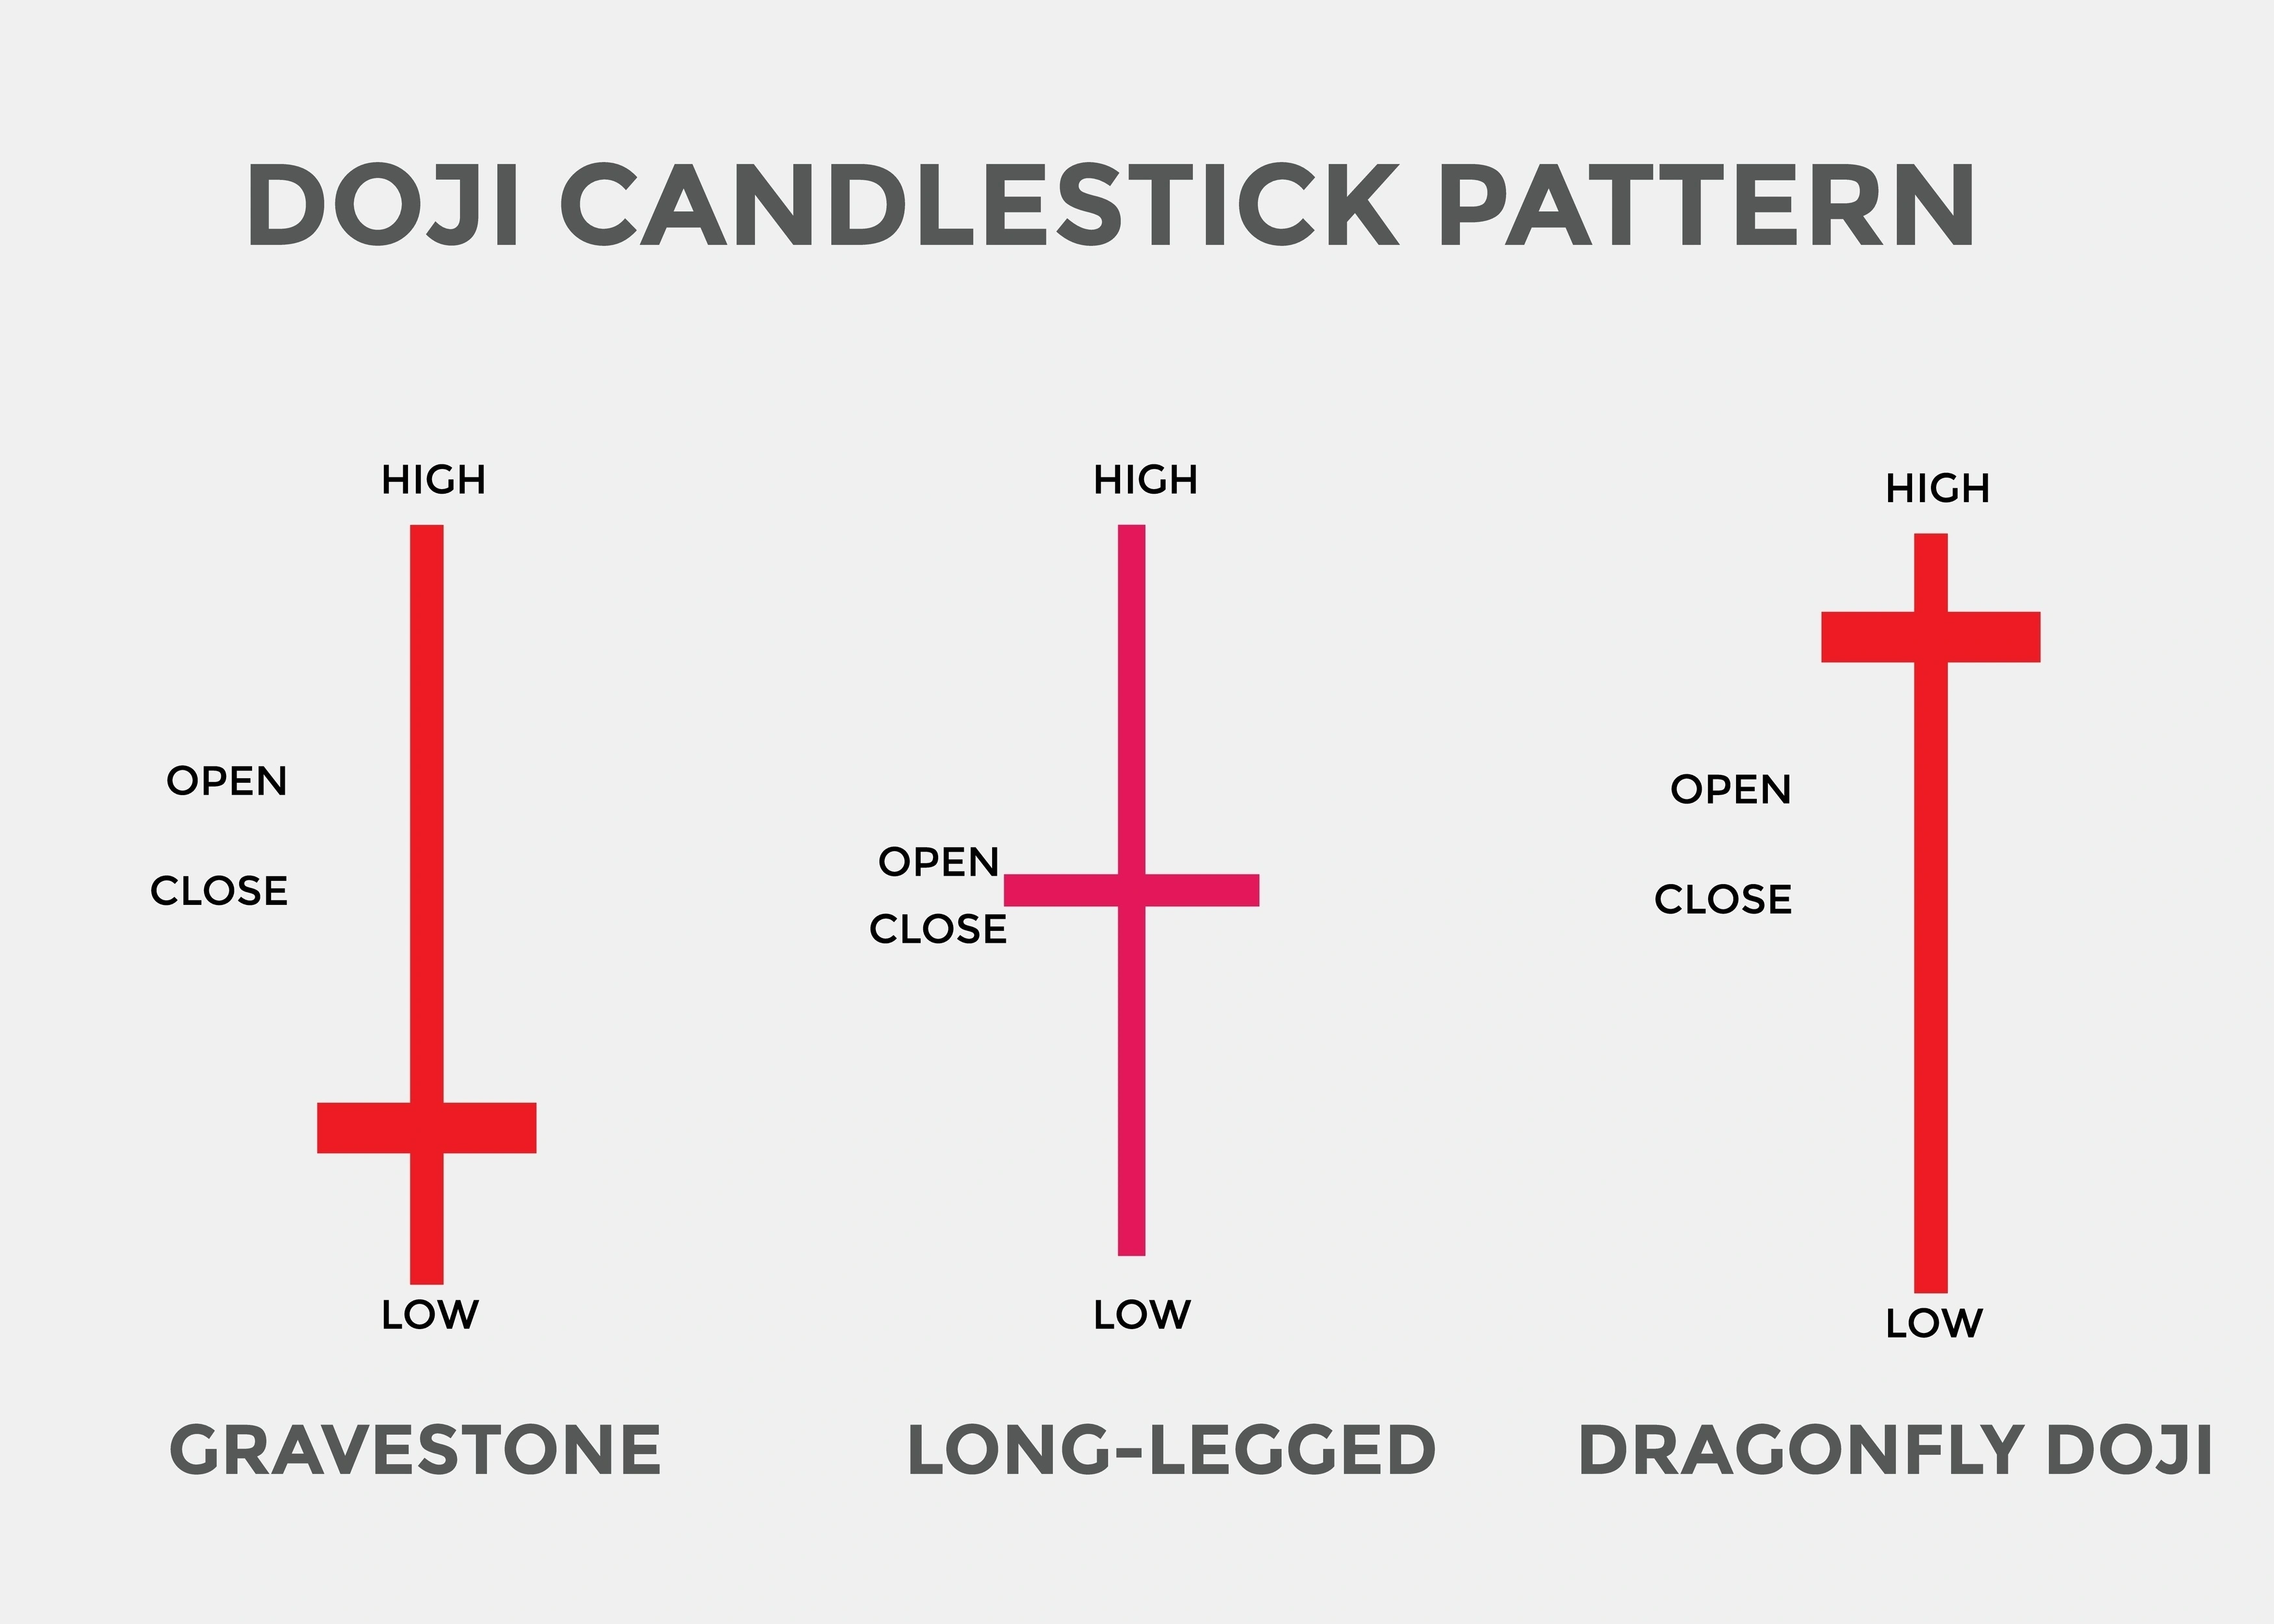 What it looks like: A "T" shaped candle where the Open, High, and Close prices are exactly the same (or incredibly close). It features a very long lower shadow.
The Psychology in NEPSE: This is a rare but incredibly powerful signal. Sellers tried to crash the stock, but buyers completely absorbed the supply, driving the price back to the exact opening level. It represents a total, absolute rejection of lower prices. When you see this near a 52-week low or major support, pay close attention.
Your Next Move: A Dragonfly Doji has a high probability of sparking a sharp reversal. Monitor the market depth (market by order) the very next morning. If you see aggressive buy orders stacking up, it's a prime time to accumulate your kitta.
Deep Dive: 👉 Master the Dragonfly Doji and learn how to avoid false signals here.
4. The Bullish Marubozu: Absolute Buyer Dominance
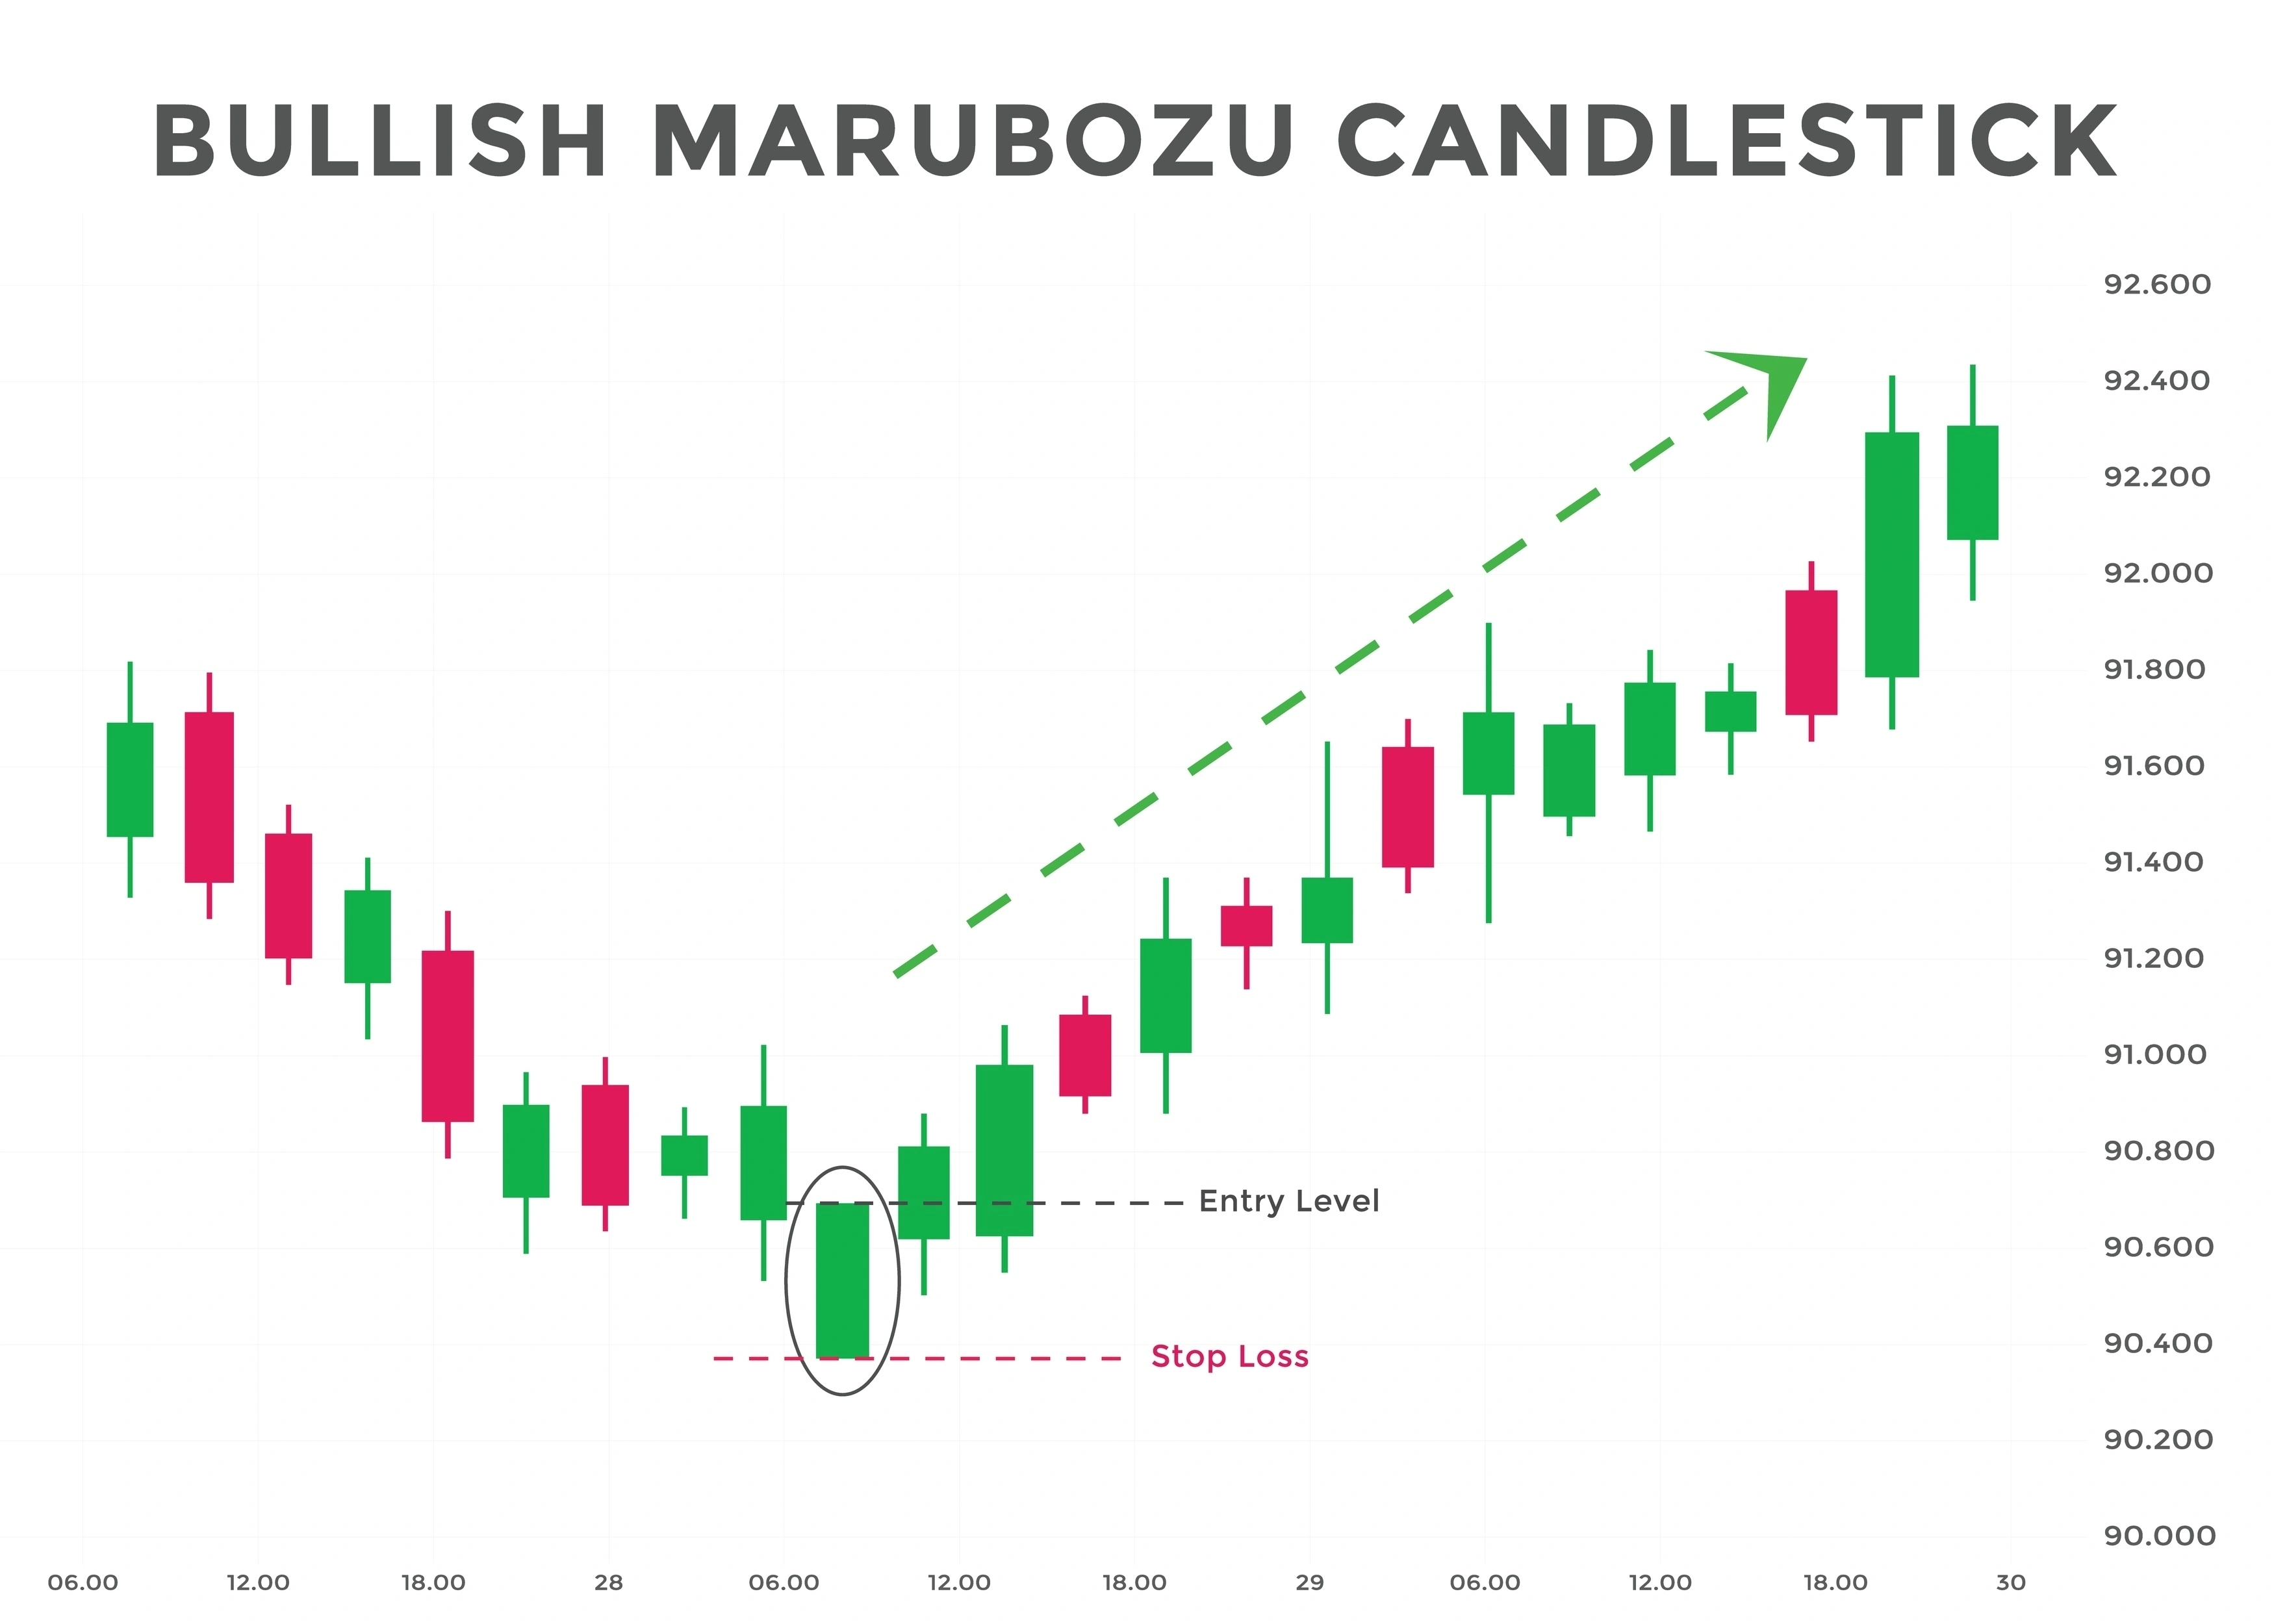 What it looks like: A long, solid green body with no shadows (no upper or lower wicks). The Open is the exact Low of the day, and the Close is the exact High of the day.
The Psychology in NEPSE: This candle screams one thing: dominance. From the opening bell at 11:00 AM to the close at 3:00 PM, buyers controlled every single tick. In the Nepali market, a Bullish Marubozu is often triggered by sudden positive news, a strong quarterly financial report, or high dividend expectations. This is the type of candle that often leads to a stock hitting the positive circuit breaker (upper circuit).
Your Next Move: This pattern shows extreme bullish momentum. It is a fantastic signal for short-term swing traders. If it breaks above a previous resistance level with heavy volume, you can ride the upward wave.
Deep Dive: 👉 Discover how to ride the momentum of the Bullish Marubozu here.