
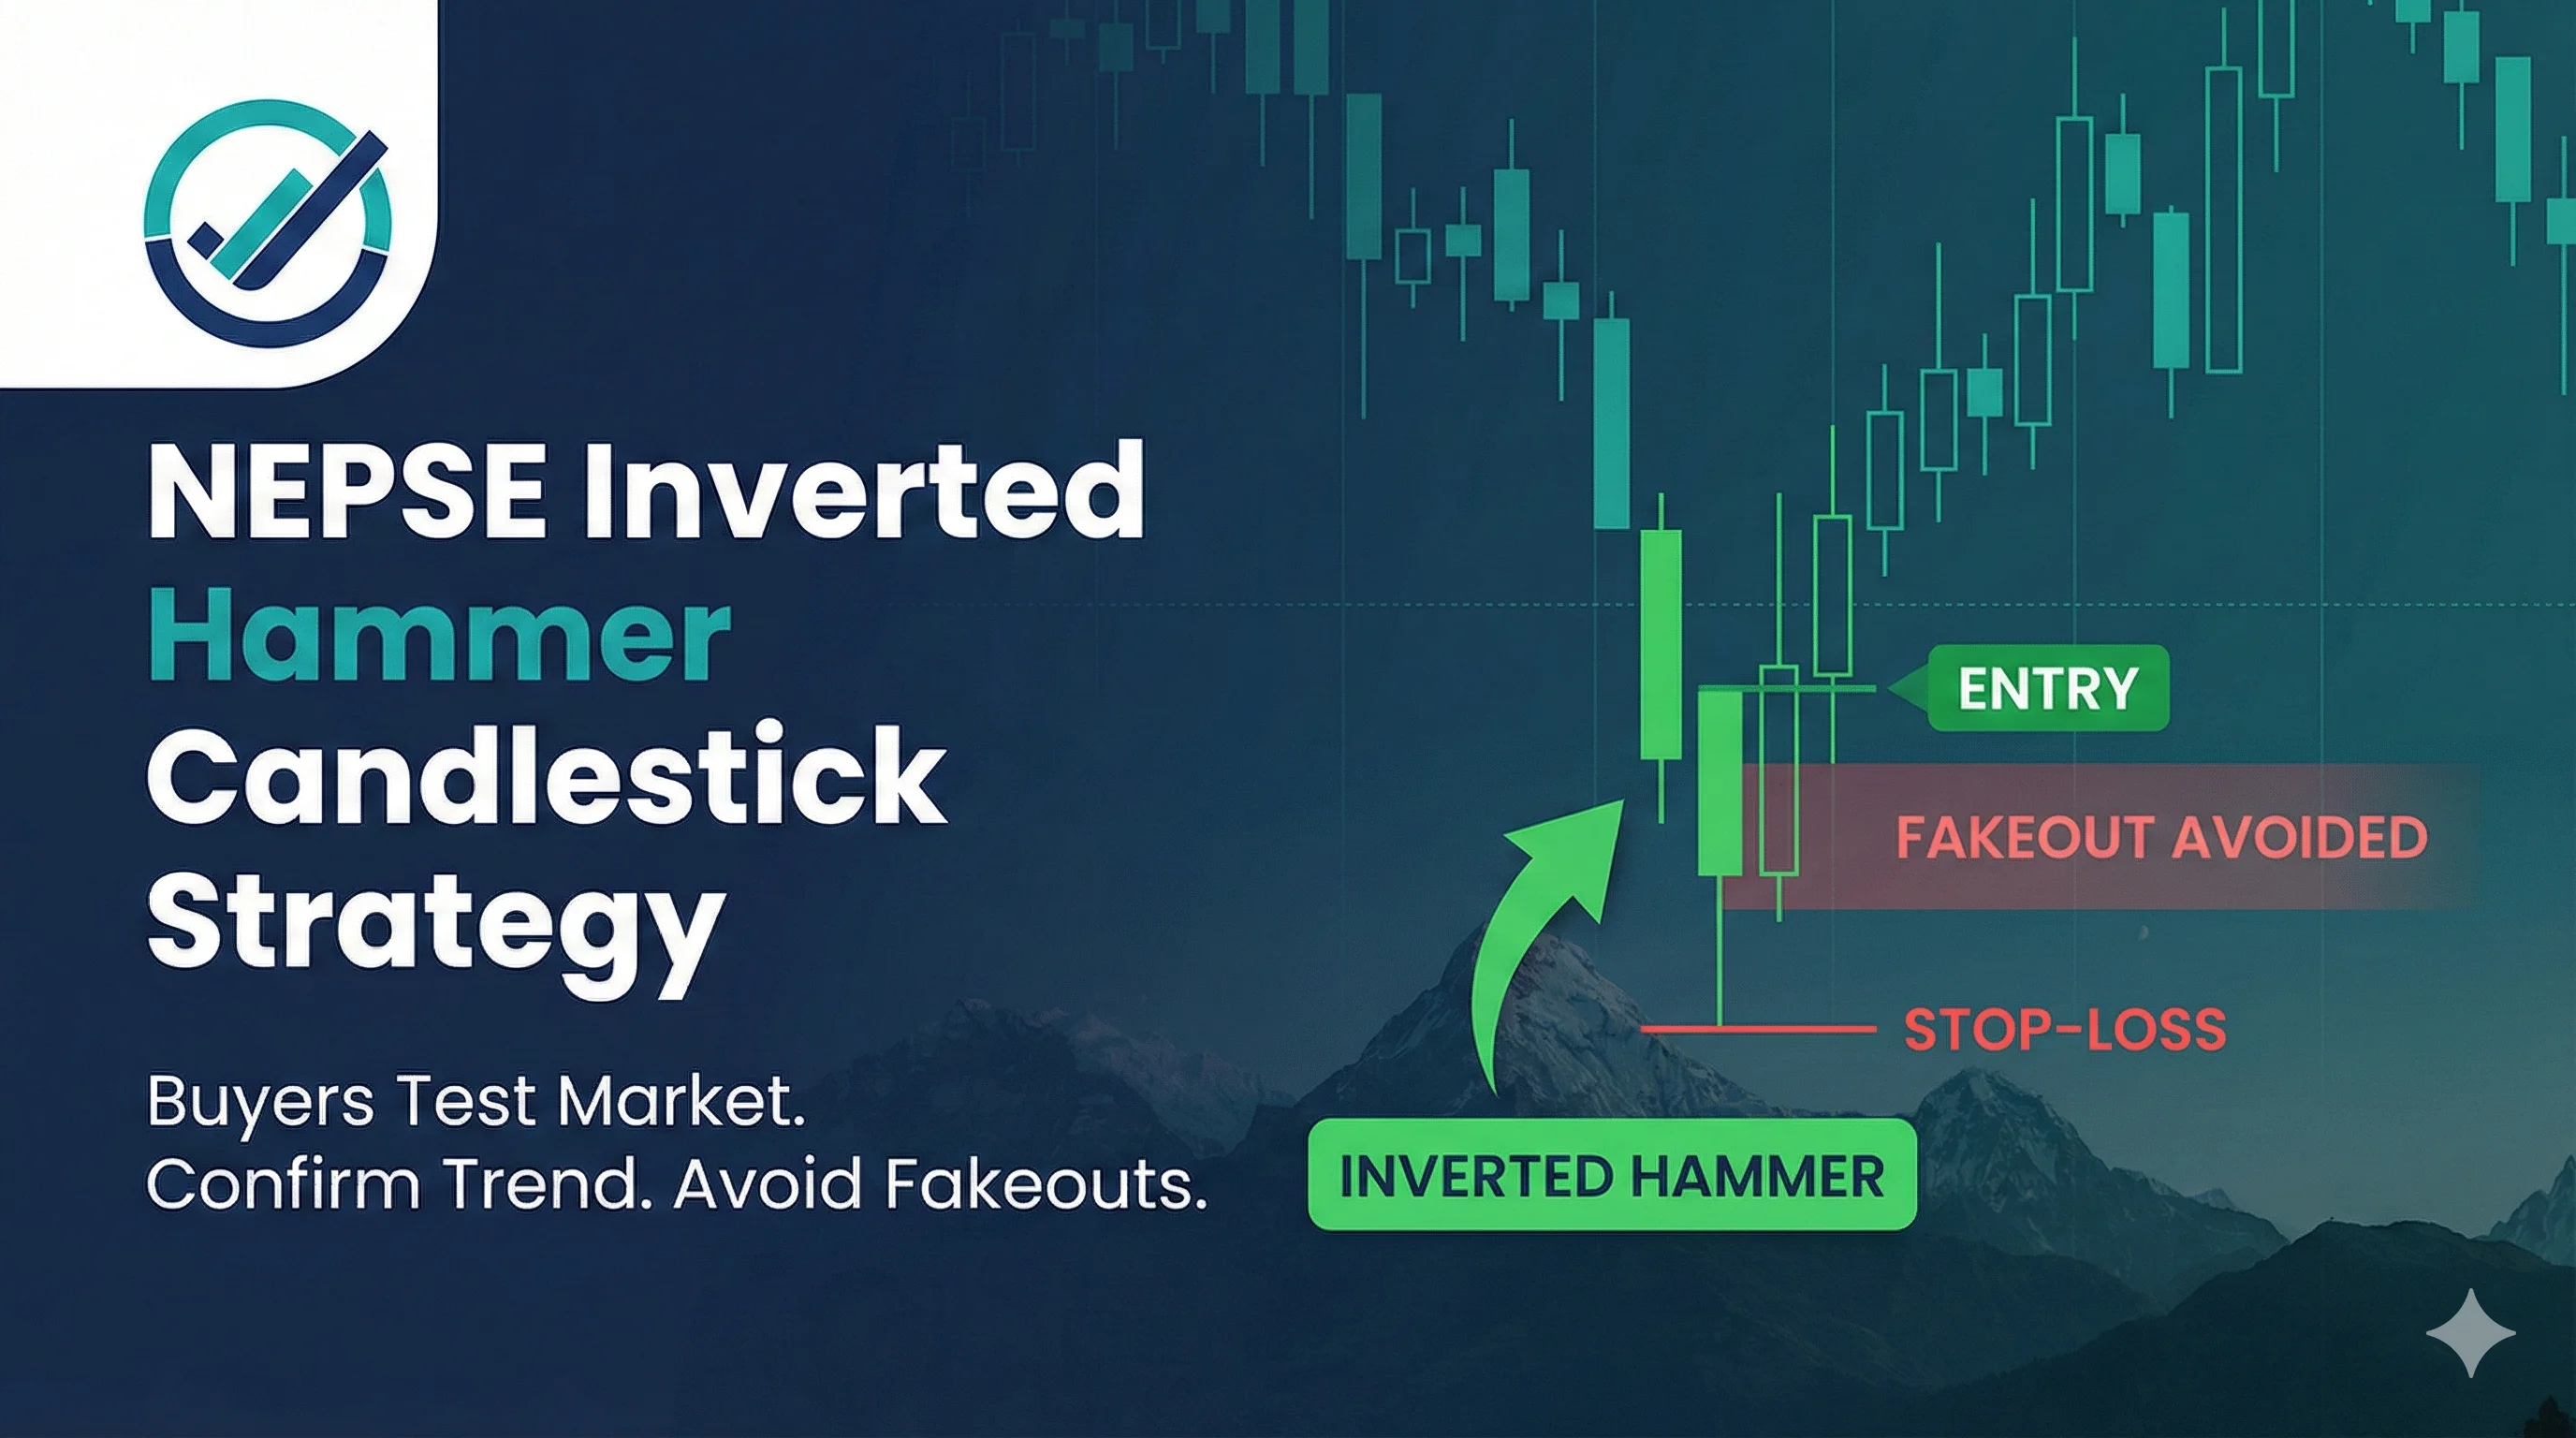
The Inverted Hammer in NEPSE: Testing the Bullish Waters
If you successfully read our previous guide on the standard Hammer Candlestick, you already know how to spot aggressive buyers scooping up shares at the bottom of a NEPSE market crash. But what happens when the bulls try to push the market up, only to be met by immediate resistance from the bears?
This creates a fascinating tug-of-war on your TMS chart known as the Inverted Hammer.
While it looks slightly different from a regular Hammer, the Inverted Hammer is still a powerful bullish reversal pattern. It serves as an early warning sign for every laganikarta (investor) that the selling pressure is drying up, and a new uptrend might be just around the corner.
Here is exactly how to identify, understand, and trade the Inverted Hammer in the Nepali share market.
What is an Inverted Hammer Candlestick?
As the name suggests, this pattern looks exactly like a standard hammer flipped completely upside down. It appears at the bottom of a prolonged downtrend.
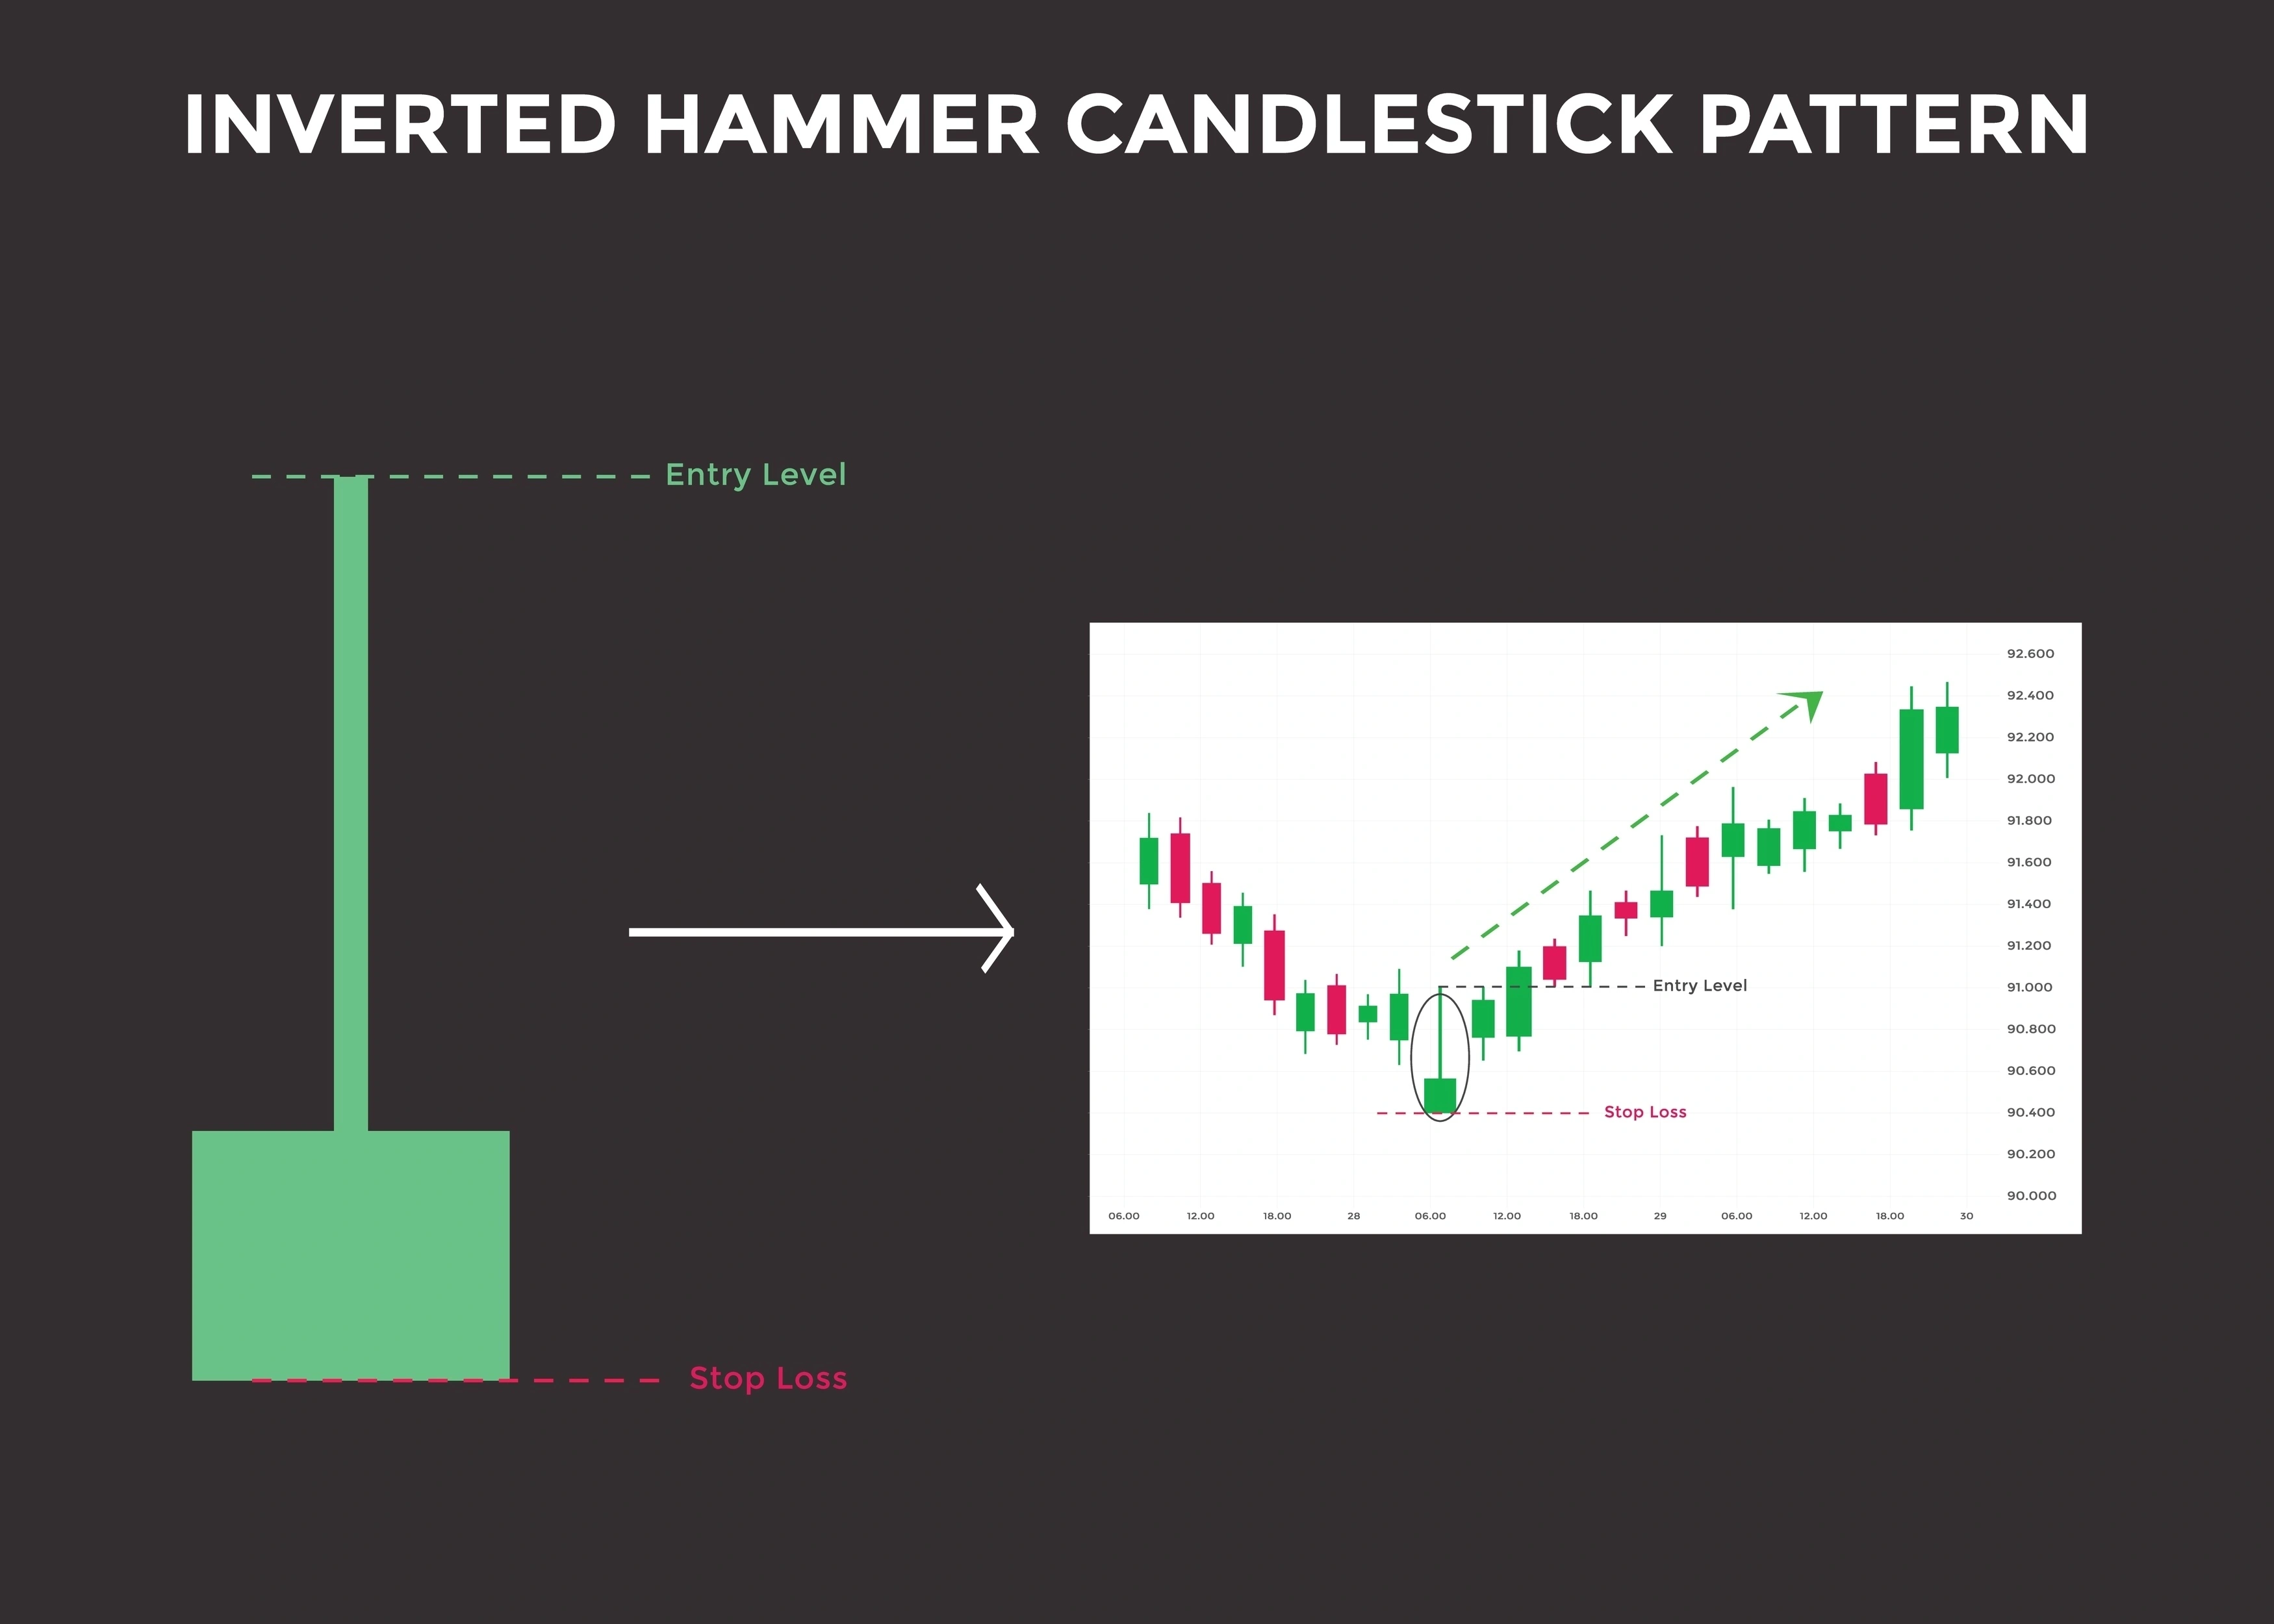
The Anatomy of a Perfect Inverted Hammer:
The Body: A very small real body located at the extreme bottom of the daily trading range. It can be green or red, though a green body (where the close is higher than the open) carries a stronger bullish sentiment.
The Upper Wick (Shadow): This is the defining feature. The upper wick must be long—at least twice the length of the real body.
The Lower Wick: There should be little to no lower shadow. The price shouldn't drop significantly below the opening bell price.
 (Note: If you see this exact same shape at the top of an uptrend, it is no longer an Inverted Hammer. It is a bearish pattern called a "Shooting Star," which signals an impending market drop!)
The Psychology: What Does It Mean in NEPSE?
To truly master technical analysis in Nepal, you need to understand what the kheladis (big players) are doing behind the scenes. The Inverted Hammer tells a story of a market trying to shift momentum.
Imagine a popular hydropower stock has been locked in a downtrend for weeks.
The Bullish Surge (11:00 AM - 1:00 PM): The market opens, and suddenly, buyers decide the stock is undervalued. They start buying kitta aggressively, pushing the price significantly higher. This creates the long upper wick.
The Bearish Pushback (1:00 PM - 3:00 PM): However, the sellers (bears) aren't completely gone yet. Seeing the price rise, trapped investors take the opportunity to sell and exit their positions. This selling pressure forces the price all the way back down near the opening price.
The Standoff: Despite the sellers pushing the price back down, they failed to push it lower than where it opened.
The main takeaway? The sellers are losing their dominance. The fact that the buyers were able to push the price up that high during the session proves that bullish momentum is secretly building. The bulls are simply "testing the waters."
How to Trade the Inverted Hammer in NEPSE
Because the sellers still showed some strength by pushing the price back down at the close, trading an Inverted Hammer requires more caution than a regular Hammer.
Here is your step-by-step game plan:
Step 1: Locate the Trend and Support Ensure the NEPSE index or the specific stock is in a clear, established downtrend. The Inverted Hammer is most effective when it forms near a historical support zone, a psychological round number (like Rs. 300 or Rs. 500), or when the RSI indicator shows the stock is oversold (below 30).
Step 2: Wait for the Ultimate Confirmation Do not buy on the day the Inverted Hammer forms. You absolutely must wait for the next trading day. To confirm the reversal, the very next candle must be a strong, bullish green candle that closes above the high of the Inverted Hammer's long upper wick. If the next day's candle is red and drops below the Inverted Hammer's body, the pattern has failed, and the downtrend will continue.
Step 3: Check the Volume In the secondary market, volume is your best friend. A valid Inverted Hammer should be accompanied by high trading volume. If the upper wick was formed on very low volume, it was likely just a random intraday fluctuation, not a genuine attempt by institutional buyers to reverse the trend.
Step 4: Execution & Risk Management
Entry: Once the confirmation candle breaks above the Inverted Hammer's high, you can execute your buy order.
Stop-Loss: Place a strict stop-loss just below the low (the bottom of the small body) of the Inverted Hammer.
Target: Look for the next major resistance line on your chart to book your profits.
Don't Get Trapped by Fakeouts
The biggest trap Nepali traders fall into with the Inverted Hammer is impatience. The FOMO (Fear Of Missing Out) kicks in, and they buy right at 2:55 PM before the market closes, assuming the stock will gap up the next day. If the macroeconomic news is bad, or liquidity is tight in the banking sector, the sellers will easily overwhelm the buyers the next morning, leaving you trapped in a losing position.
Always wait for the confirmation candle. Let the market prove to you that the bulls have actually won the battle.
Ready to move on from Single-Candle patterns? Now that you know how to read individual days, it's time to learn what happens when two days of price action combine to create an unstoppable trend reversal. 👉 Read our complete guide to the Bullish Engulfing Pattern here!