
The Hammer Candlestick Pattern in NEPSE: How to Catch the Market Bottom
Every laganikarta in Nepal knows the feeling of a bear market. The NEPSE index is dropping, your portfolio is bleeding red, and panic selling takes over the TMS. But what if there was a way to identify the exact day the panic stops and the smart money steps in?
In technical analysis, the Hammer Candlestick is one of the most reliable and powerful single-candle reversal patterns. When formed at the right location, it acts as a massive "Buy" signal, indicating that the bears have exhausted their supply and the bulls are taking control.
Here is your complete guide to identifying, confirming, and trading the Hammer candlestick in the Nepali share market.
What is a Hammer Candlestick?
The Hammer is a bullish reversal pattern that appears at the bottom of a downtrend. Visually, it looks exactly like a hammer with a short handle.
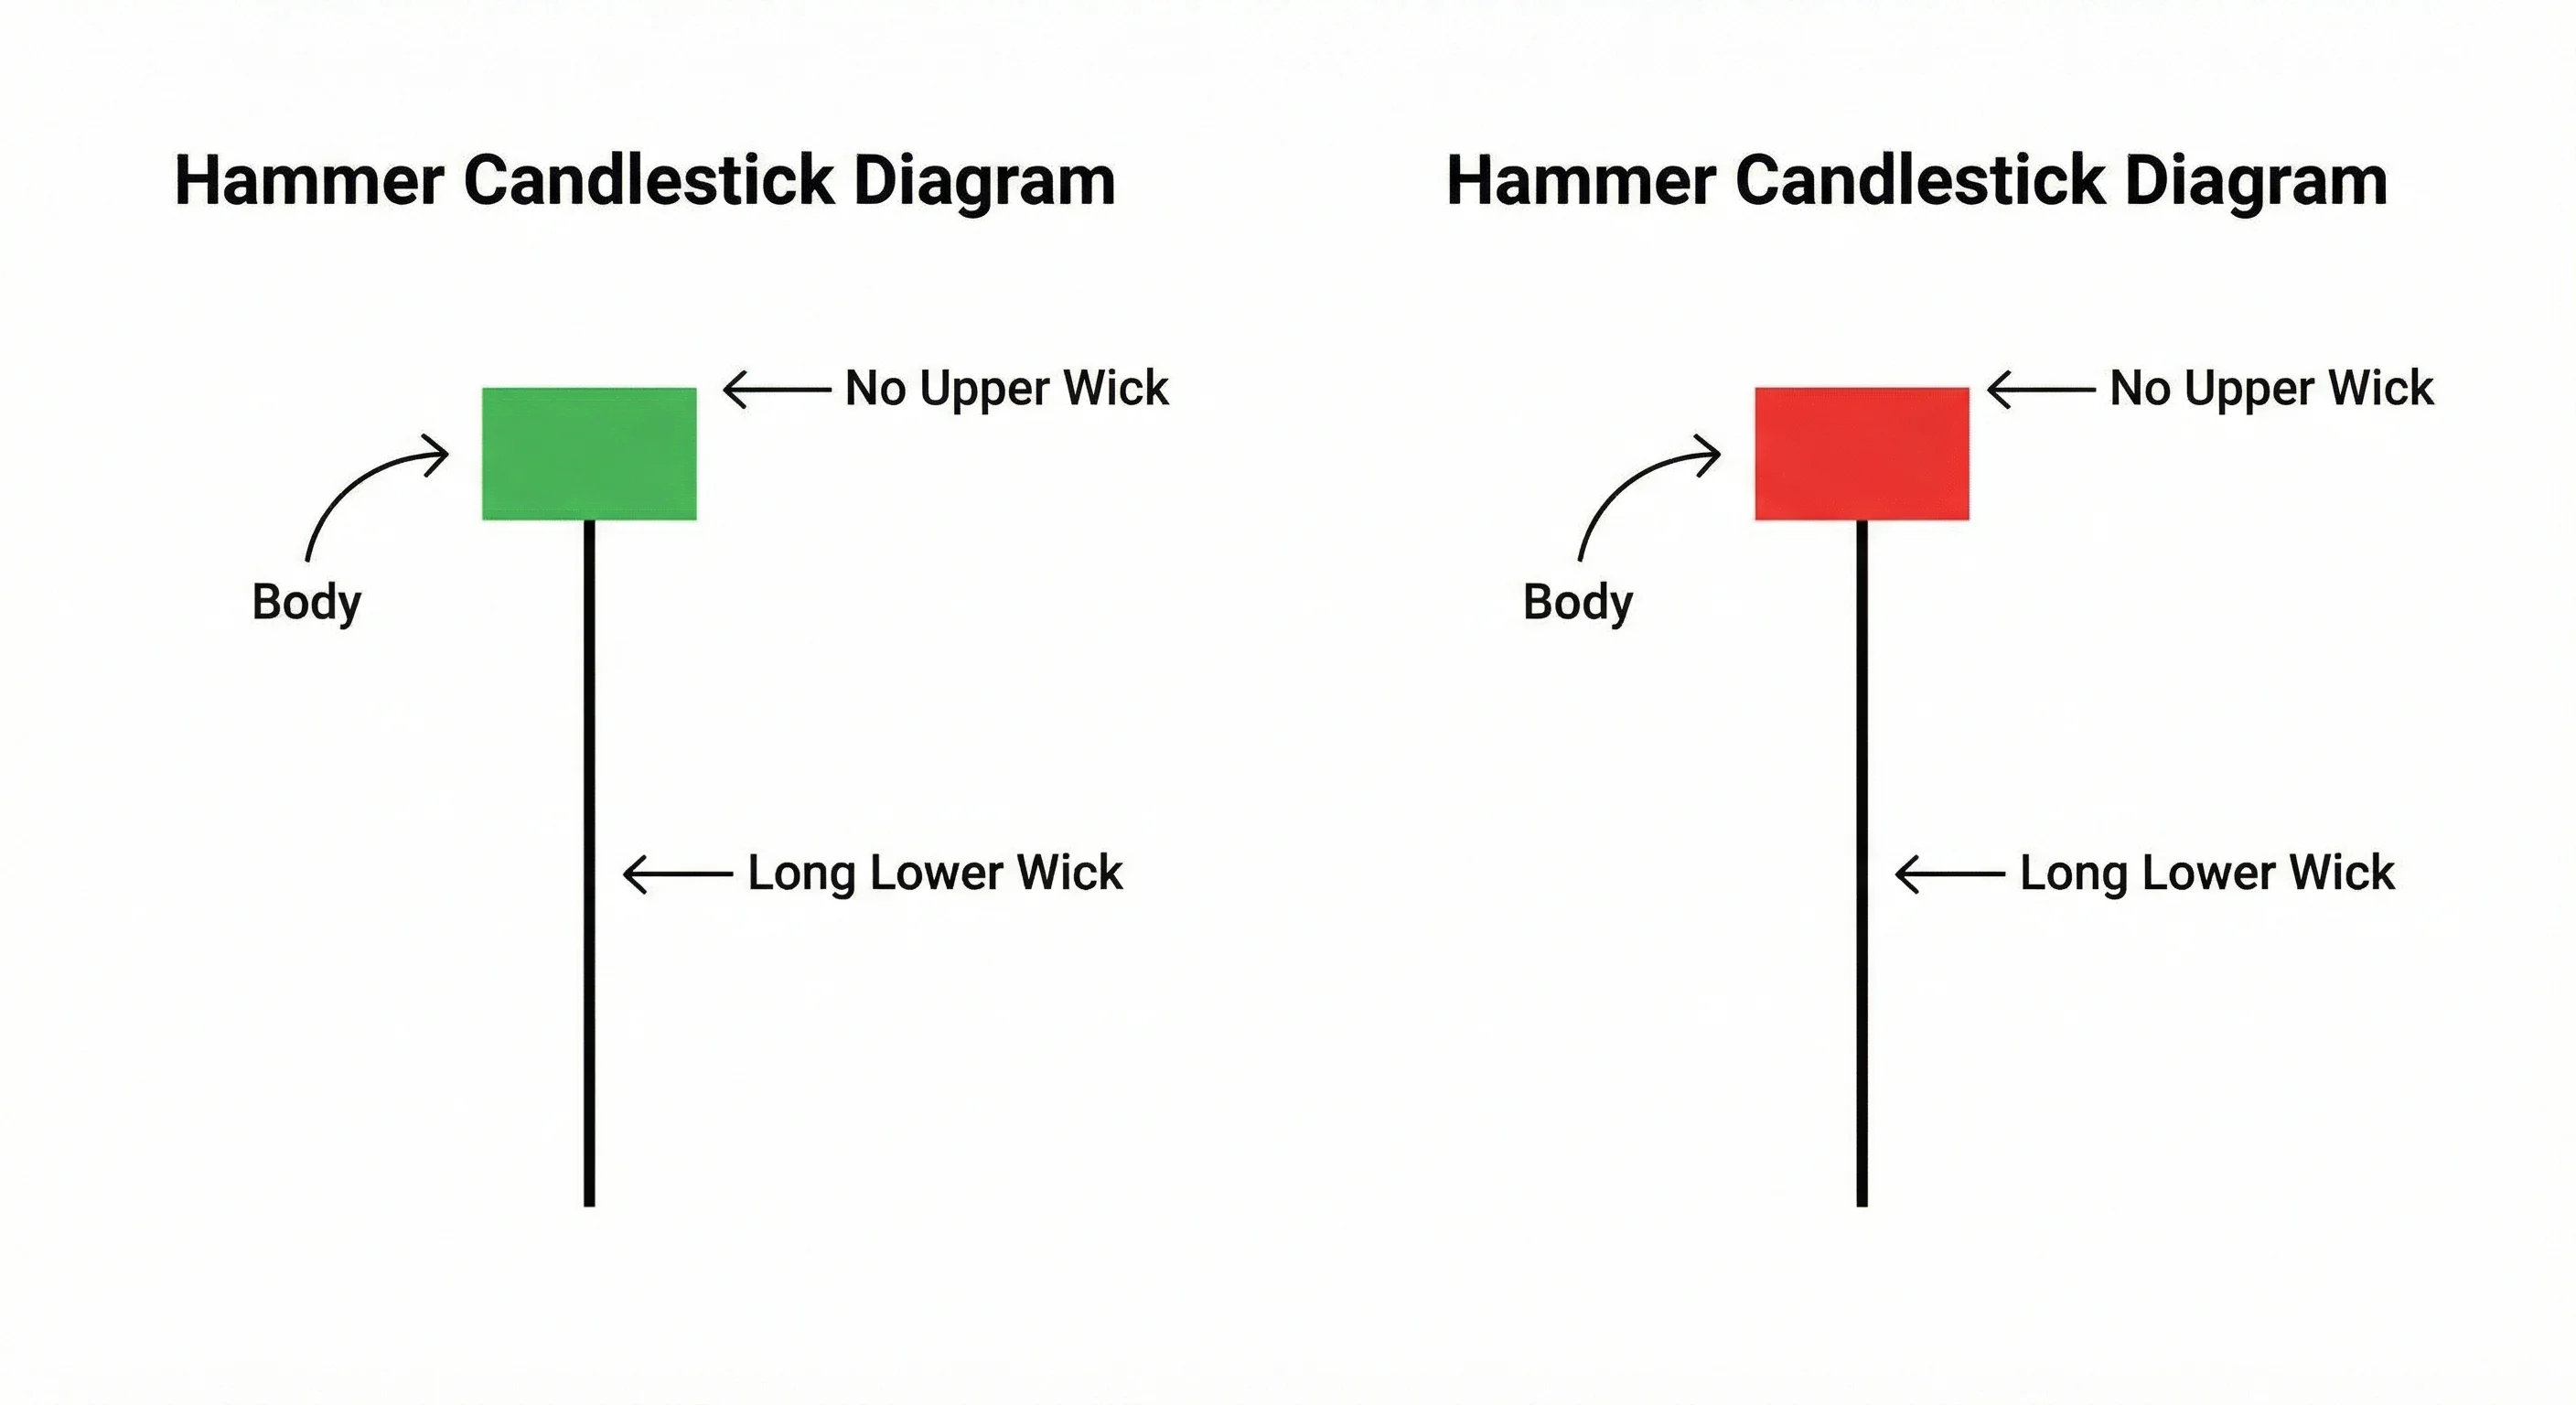
The Anatomy of a Perfect Hammer:
The Body: A small real body (the difference between the open and close price) located at the very top of the day's trading range. The body can be either green or red, but a green body is considered much more bullish because it means buyers pushed the price above the opening bell price.
The Lower Wick (Shadow): This is the most important part. The lower wick must be at least twice the length of the real body (ideally three times longer).
The Upper Wick: There should be little to no upper wick. If there is a small one, that is acceptable, but a completely flat top is the strongest signal.
The Psychology: What Does a Hammer Mean in NEPSE?
To understand why the Hammer works, you need to understand the psychology of the buyers and sellers during trading hours (11:00 AM to 3:00 PM).
Imagine a popular commercial bank stock has been falling for five consecutive days.
Morning Panic (11:00 AM - 1:00 PM): When the market opens, retail investors panic and aggressively dump their kitta. The price crashes, forming the long lower wick.
Smart Money Enters (1:00 PM - 3:00 PM): The price drops so low that it hits a major support zone or becomes severely undervalued. Suddenly, the kheladis (institutional buyers and experienced traders) see a massive discount. They step in and buy everything the panic sellers are throwing at them.
The Rejection: The buying pressure is so intense that the price is driven all the way back up, closing near or even above the opening price.
The long lower wick is the footprint of the bulls. It represents a total rejection of lower prices.
How to Trade the Hammer Pattern in NEPSE
Seeing a Hammer on your chart doesn't mean you should immediately log into your MeroShare or TMS and hit buy. Location and confirmation are everything.
Follow these 4 steps to trade the Hammer pattern safely:
Step 1: Verify the Trend (Context is King) A Hammer is only a Hammer if it appears after a clear downtrend. If the stock is moving sideways or is already at an all-time high, this shape is meaningless (in fact, at the top of an uptrend, it's called a "Hanging Man" and is a bearish signal).
Step 2: Look for Support Levels The highest probability Hammer patterns form at key technical levels. Check your NEPSE chart to see if the Hammer is bouncing off:
A previous historical support line.
A major moving average (like the 50-day or 200-day EMA).
The lower band of the Bollinger Bands.
An oversold RSI level (below 30).
Step 3: Wait for Confirmation Never buy on the day the Hammer forms. Wait for the next trading day. You need a green confirmation candle that closes higher than the Hammer’s body. This proves that the bulls have maintained their momentum.
Step 4: Execute Your Trade
Entry: Buy near the close of the confirmation candle (around 2:45 PM on Day 2) or at the open of Day 3.
Stop-Loss: Place your strict stop-loss just a few rupees below the lowest tip of the Hammer's wick. If the price breaks below that wick, the setup is invalidated, and the downtrend will likely continue.
Target: Set your profit target at the next major resistance level or aim for a 1:2 Risk-to-Reward ratio.
The Trap: Why Do Hammers Sometimes Fail?
Even the best patterns fail, especially in a sentiment-driven market like Nepal. If the overall macroeconomic data is poor (e.g., Nepal Rastra Bank tightens liquidity or interest rates spike), a single Hammer might just be a temporary "dead cat bounce" before further falling.
Always check the volume. A Hammer formed on very low trading volume indicates that the reversal was just a lack of sellers, not a surge of strong buyers. You want to see the Hammer—and the confirmation candle—accompanied by high turnover to ensure the big players are actually participating.
Ready to master the next single-candle pattern? Now that you know how to catch the absolute bottom, what happens when the bulls try to push the price up but face immediate resistance? 👉 Read our complete guide to the Inverted Hammer Candlestick here.