
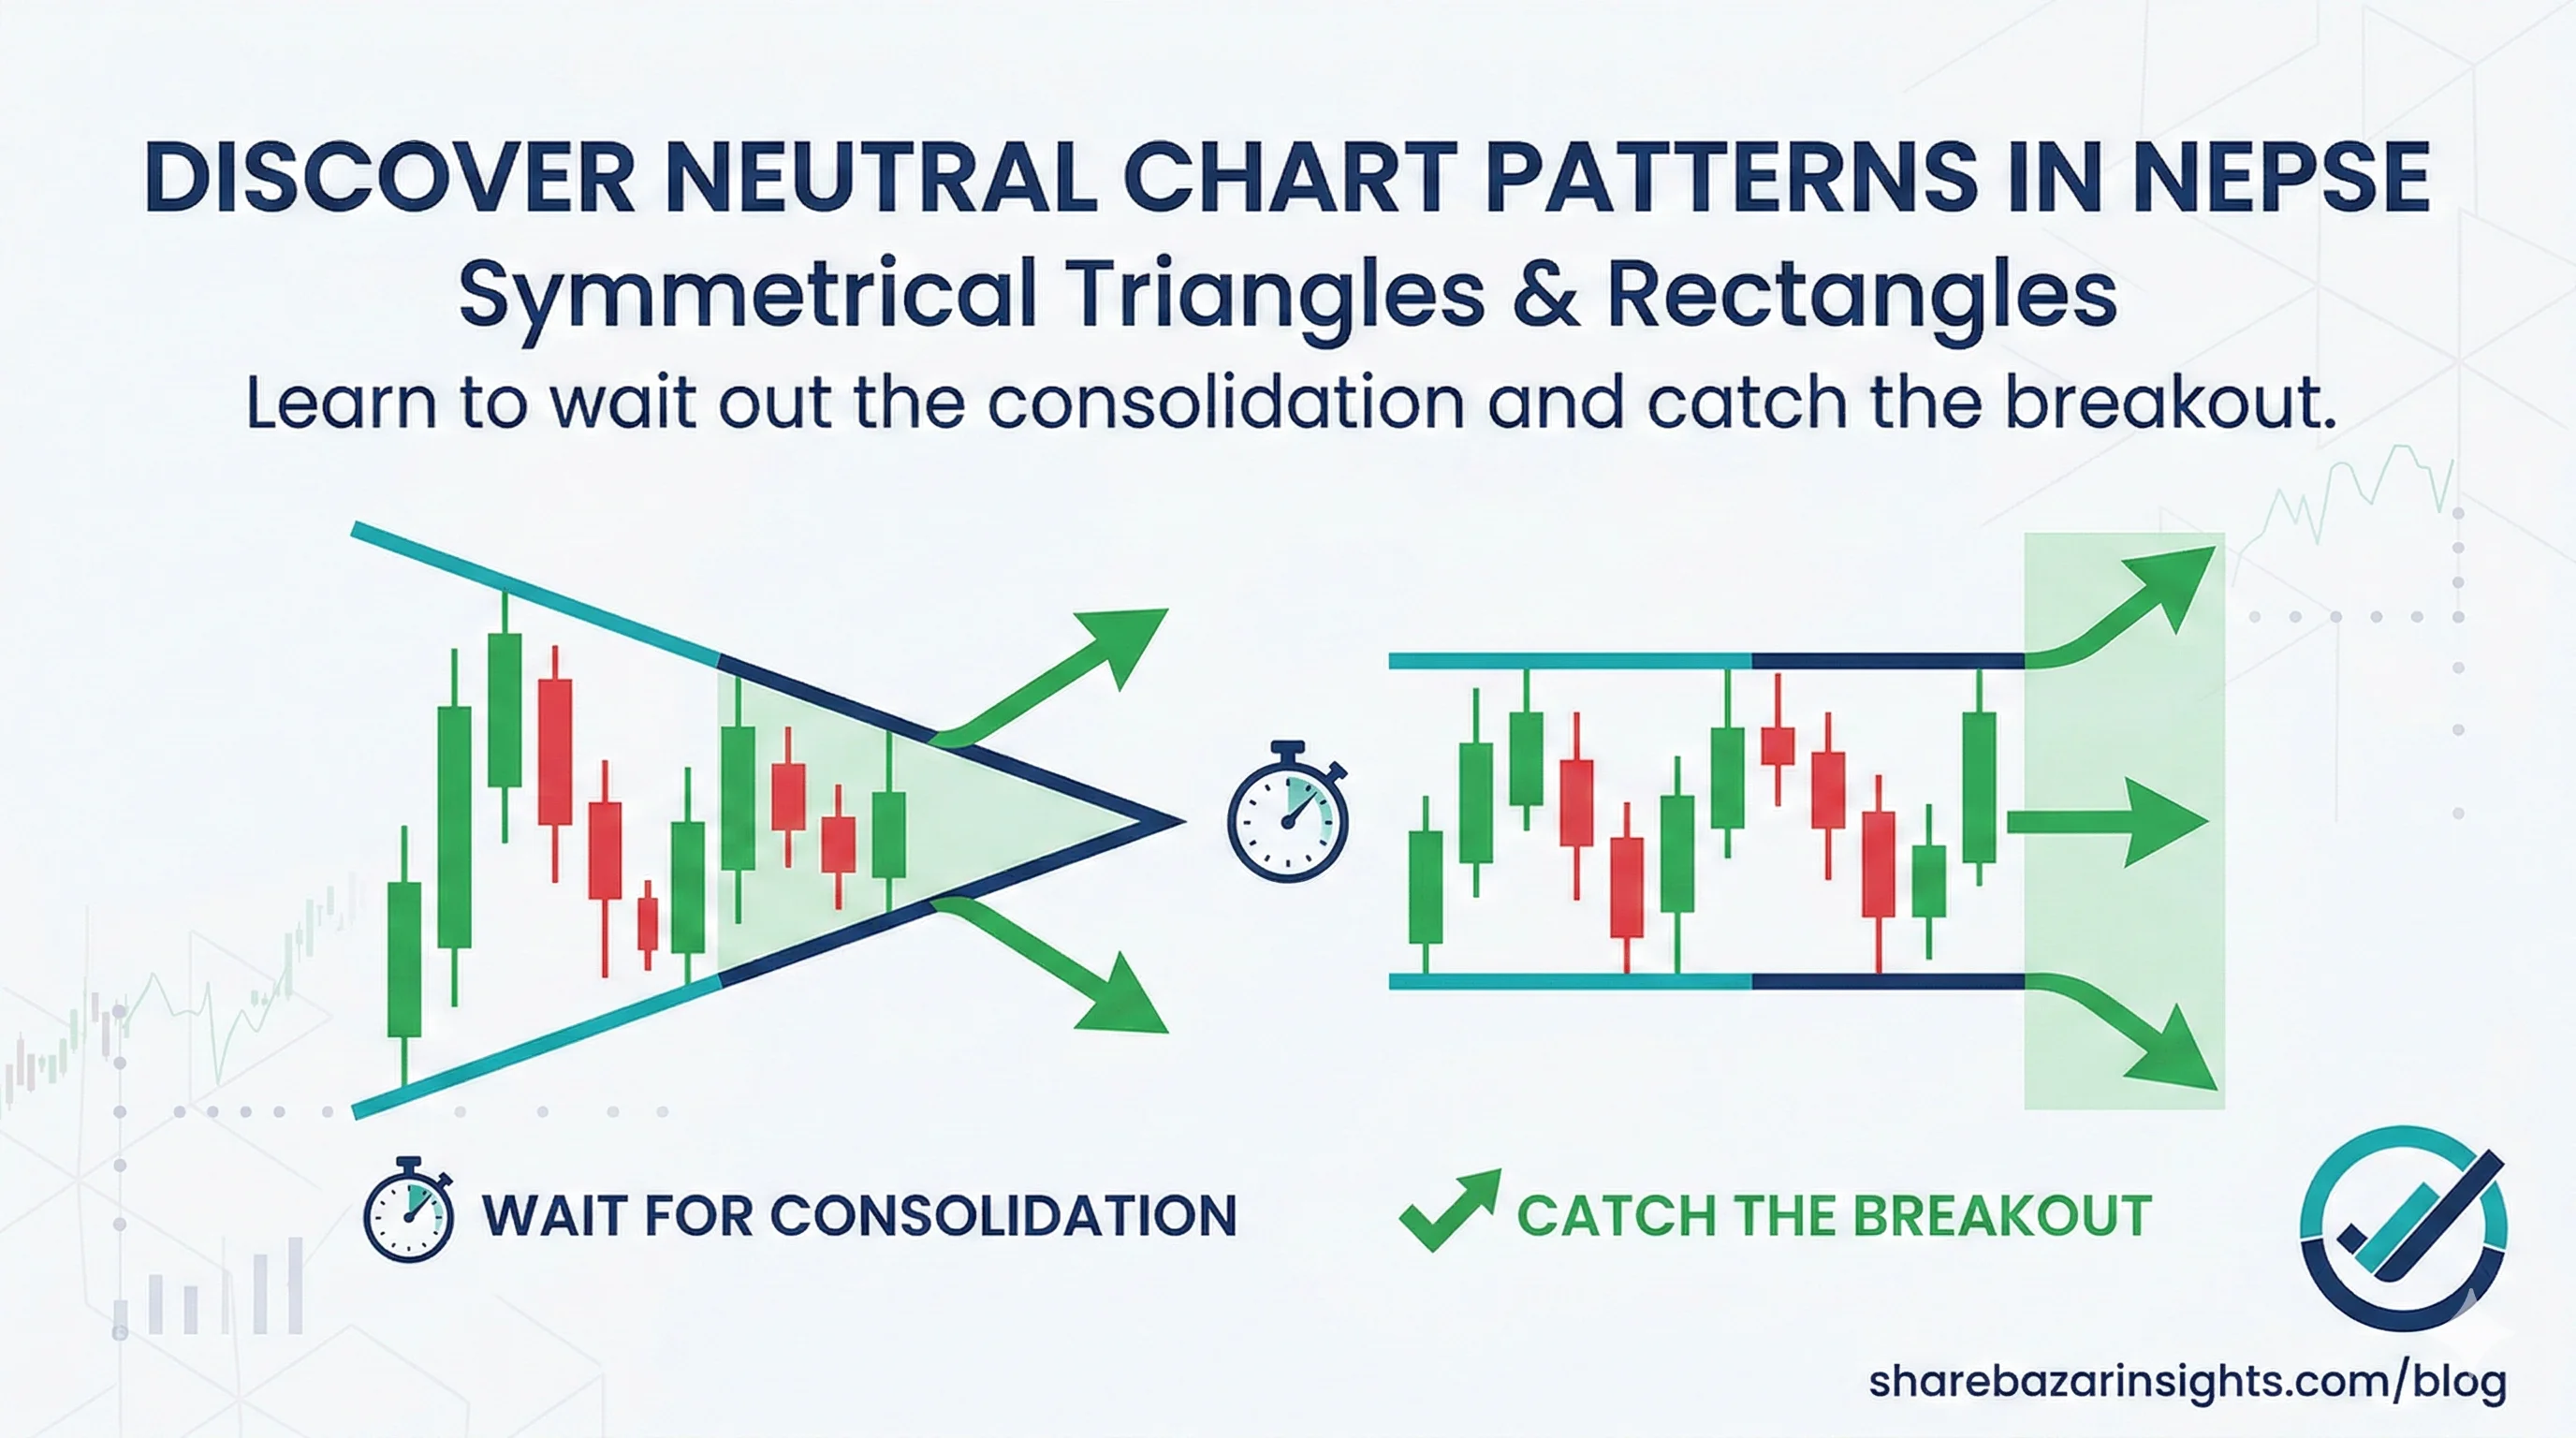
In the Nepal Stock Exchange (NEPSE), the market isn't always moving in a clear direction. Sometimes, the bulls and the bears are perfectly matched. The buying pressure equals the selling pressure, and the price gets trapped in a tight, sideways range.
When this happens, the market forms Neutral (or Bilateral) Chart Patterns.
For a laganikarta, these patterns can be frustrating because they require a lot of patience. However, this sideways consolidation is actually a sign that massive volatility is brewing. The market is winding up like a spring, and a massive breakout is coming. Because we cannot short-sell in NEPSE, our strategy here is simple: wait on the sidelines, watch for the upward breakout, and ride the new wave of momentum.
Let's look at the two most powerful neutral patterns you will spot in your NEPSE charts.
1. The Symmetrical Triangle: The Ultimate Squeeze
The Symmetrical Triangle forms when a stock's price range gets squeezed tighter and tighter over time. It shows a market that is completely deadlocked.
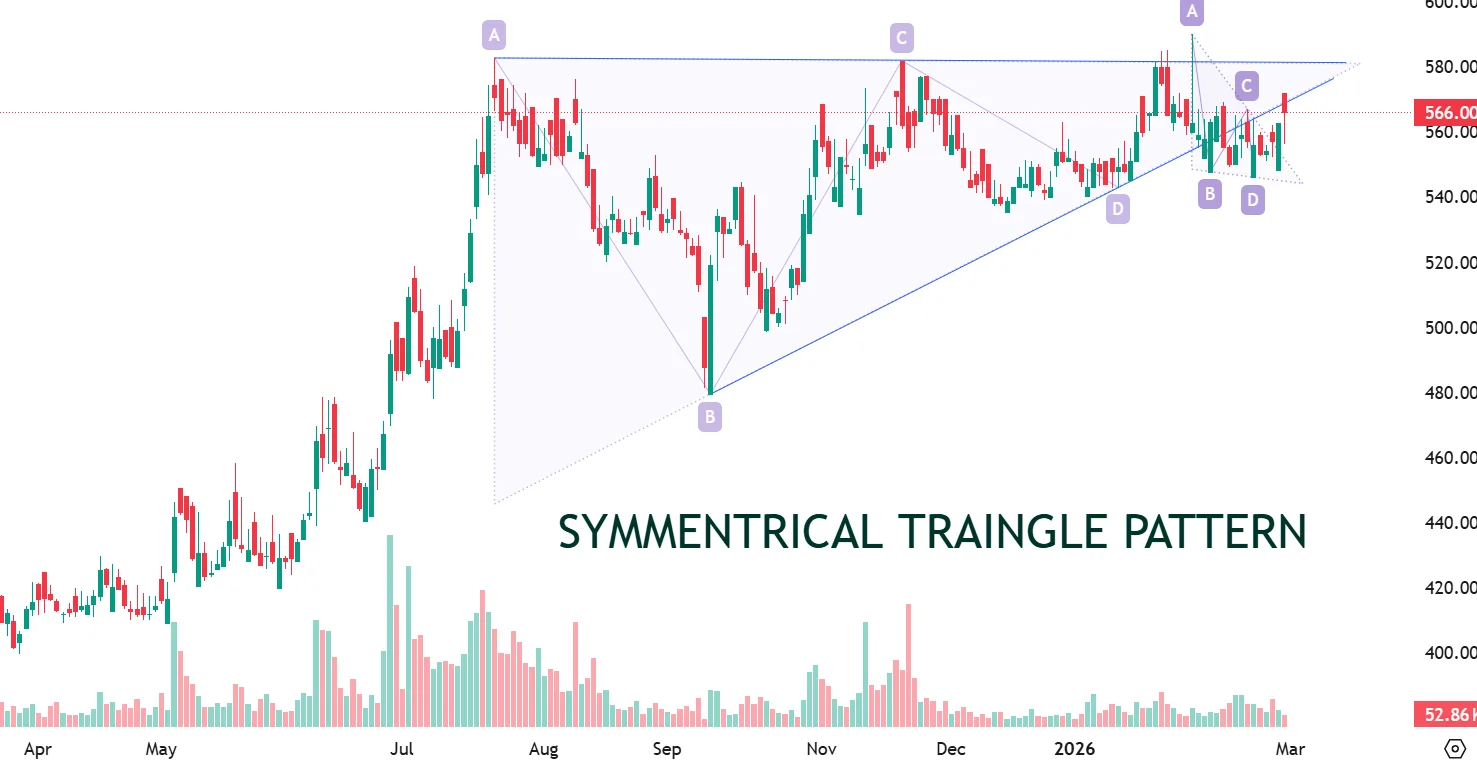
The NEPSE Context: Buyers are stepping in at slightly higher lows, but sellers are also stepping in at slightly lower highs. The two sides are pushing against each other, shrinking the price into the point of a triangle. Eventually, one side runs out of capital, and the stock explodes out of the triangle.
🎯 Next Move for Laganikartas: Do not try to guess which way it will break! Keep the stock on your watchlist and wait for a daily candle to close cleanly above the upper downward-sloping trendline before buying.
➡️ Learn exactly how to time your entry for a Symmetrical Triangle breakout here.
2. The Rectangle (Box Consolidation): The Sideways Trap
Unlike a triangle that squeezes to a point, a Rectangle pattern (or Box Consolidation) moves perfectly horizontally. The stock bounces between a flat ceiling and a flat floor for weeks or even months.
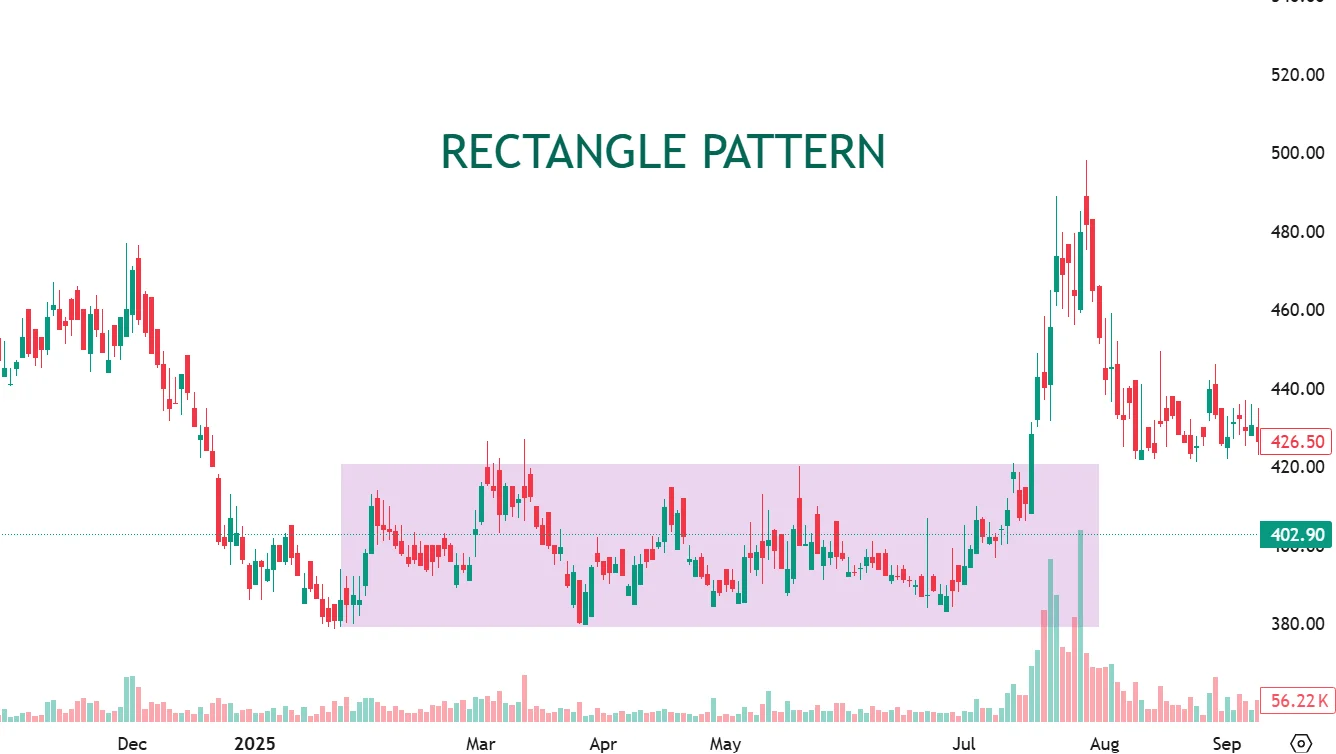
The NEPSE Context: This is the ultimate test of retail patience. The stock isn't crashing, but it isn't making anyone rich either. Smart money often uses this long, boring sideways period to quietly accumulate shares before triggering a massive rally.
🎯 Next Move for Laganikartas: Draw the box on your chart and set a price alert just above the resistance ceiling. Watch out for "fake breakdowns" where the smart money tries to trigger your stop-loss before pushing the price higher.
➡️ Discover how to survive the sideways market and trade the Rectangle breakout here.
💡 Pro Tip for Nepali Investors: How do you know if a breakout from a neutral pattern is real or a fakeout? Volume! A true bullish breakout from a Symmetrical Triangle or a Rectangle must be accompanied by a massive spike in daily turnover. If the price breaks upward but the volume is low, do not buy—it is likely a trap.