
In the Nepal Stock Exchange (NEPSE), investors love action. But sometimes, a stock simply stops trending. Instead of going up or down, it moves perfectly sideways, bouncing between a flat price ceiling and a flat price floor for weeks or even months.
This creates a Rectangle pattern (also known as a Box Consolidation). While a sideways market might seem boring, experienced laganikartas know that a massive, highly profitable breakout is brewing. You just have to survive the boredom—and the traps—to catch it.
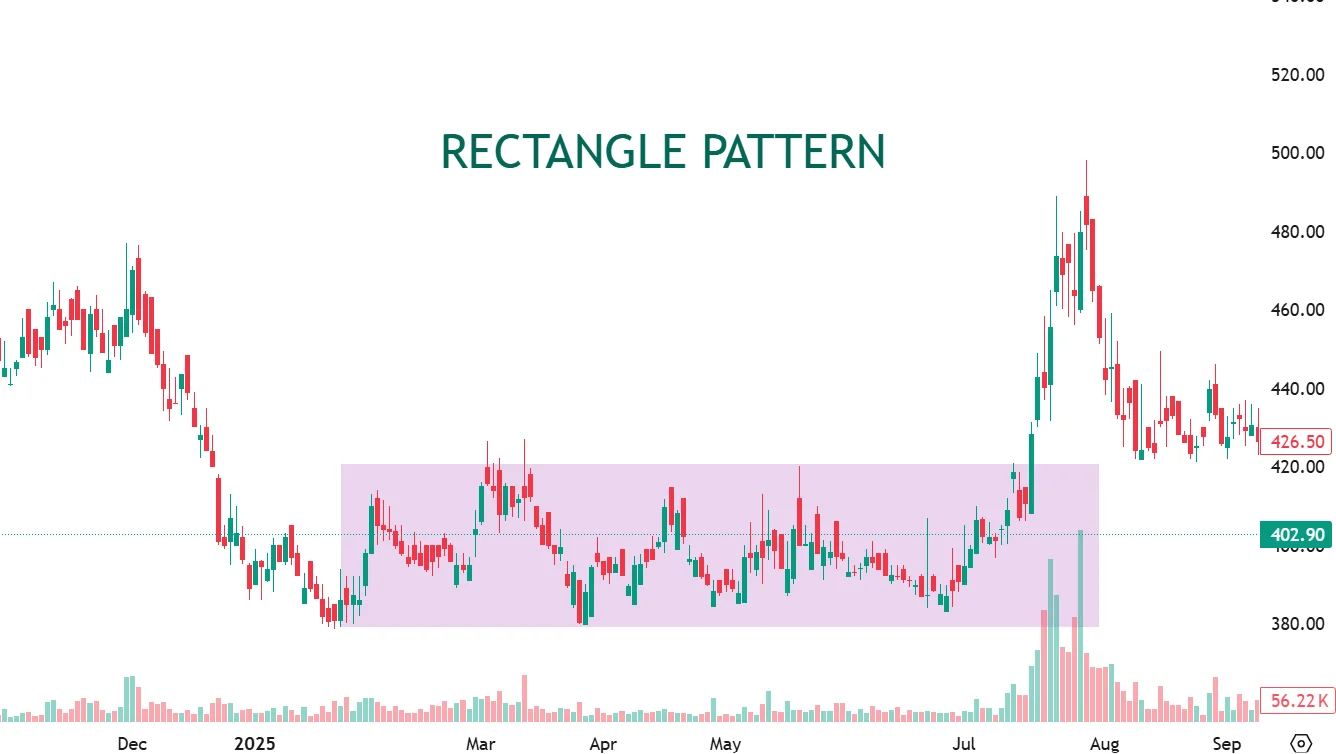
Anatomy of the Rectangle Pattern
A Rectangle represents a perfect, temporary balance between buyers and sellers.
🛑 The Flat Ceiling (Resistance): Sellers consistently step in at a specific high price, preventing the stock from going further.
🛑 The Flat Floor (Support): Buyers consistently step in at a specific low price, preventing the stock from dropping.
📦 The Box: The price bounces horizontally between these two parallel lines.
🚀 The Breakout: Eventually, one side runs out of capital, and the price breaks aggressively out of the box.
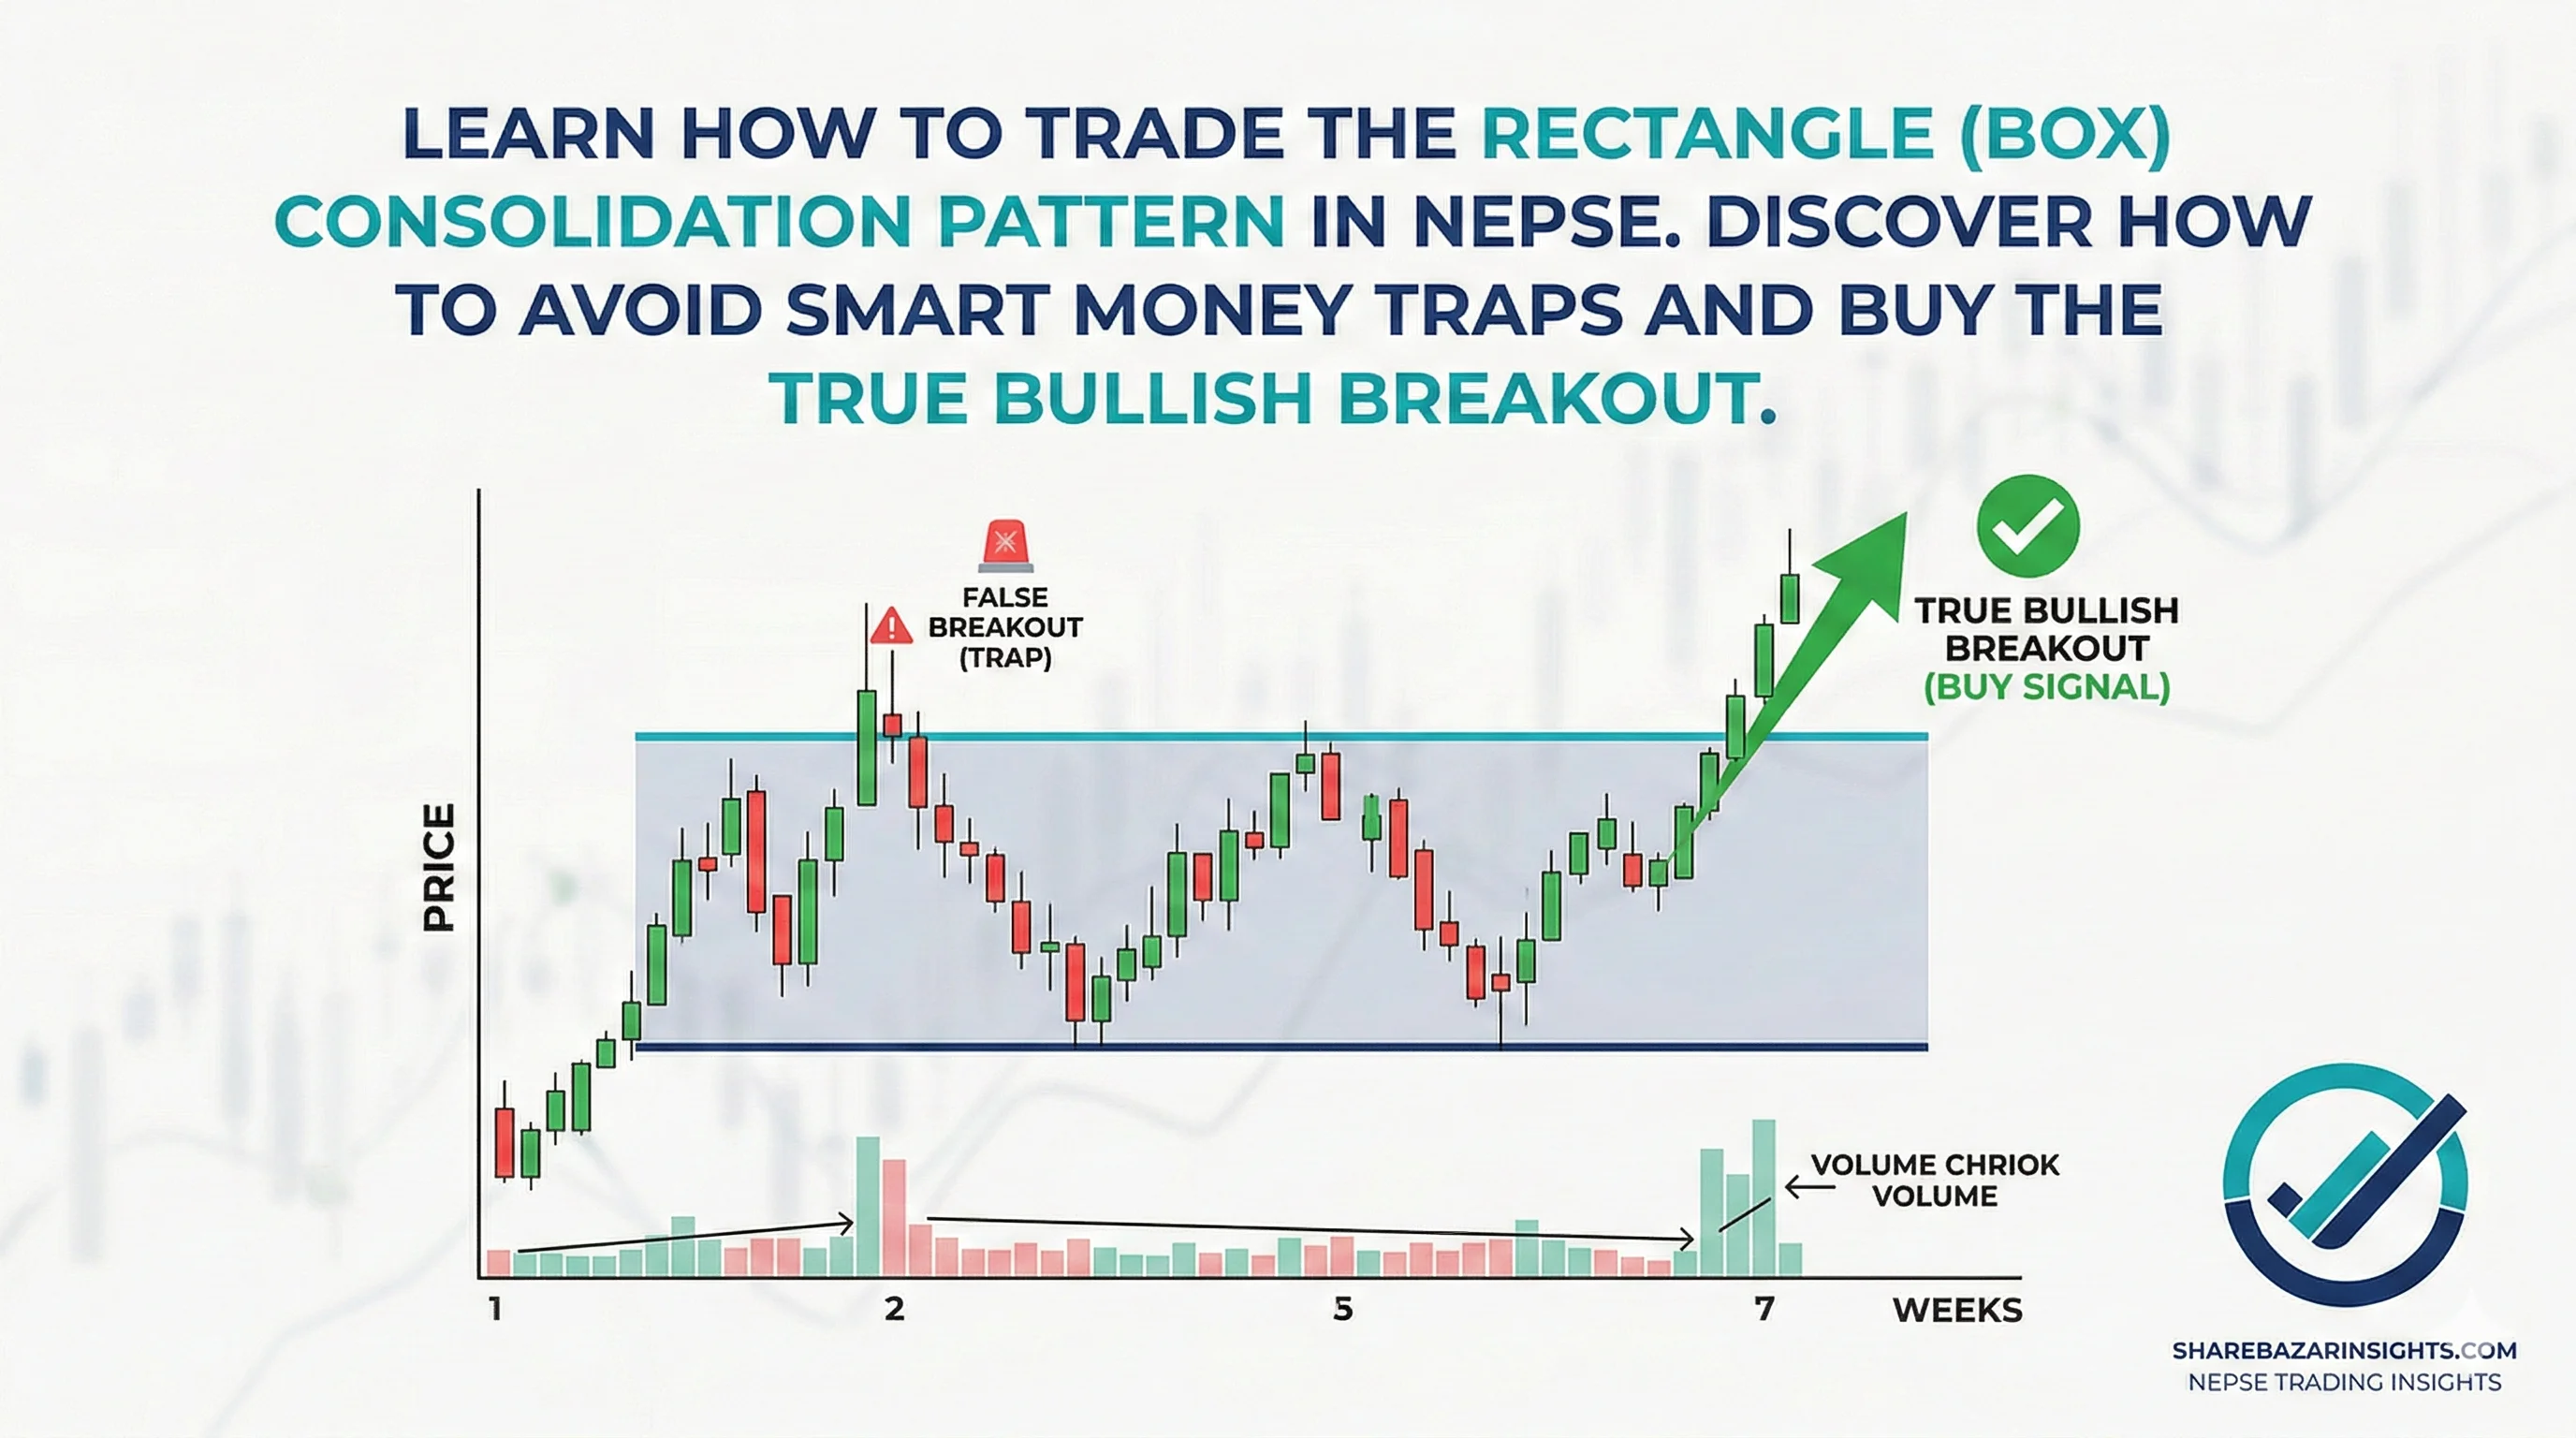
The Psychology: Boredom and The "Shakeout" Trap
The Rectangle is the ultimate test of retail patience. Because the stock isn't going anywhere, many laganikartas get bored, sell their shares, and move on to more exciting scrips.
This is exactly what the smart money wants. Institutional investors use this quiet period to slowly accumulate shares. But before they trigger the massive upward breakout, they often pull a trick known as a "Shakeout" or "Bear Trap."
They will temporarily push the price slightly below the bottom support line. This creates a fake breakdown, tricking the remaining retail investors into panic-selling to cut their losses. The smart money immediately buys up all those heavily discounted shares, and then aggressively pushes the price back up through the ceiling for the real breakout.
How to Trade It Safely in NEPSE
Because the NEPSE only allows us to profit from upward movement, trading a Rectangle requires extreme discipline:
🚦 The Entry Signal: Do not buy while the stock is still bouncing inside the box. Wait patiently until a daily candlestick closes cleanly and decisively above the flat resistance ceiling.
📊 The Trap Detector (Volume): How do you avoid the fake breakdown trap? Look at the volume (turnover). A fake breakdown usually happens on low volume. A true, valid bullish breakout must happen on a massive spike in daily turnover.
🛡️ The Stop Loss: Once you buy the bullish breakout, place your stop loss just inside the top of the box. If the price falls back into the middle of the rectangle, the breakout has failed.
🎯 The Target: Measure the total height of the box (from floor to ceiling). Add that distance to your breakout point to find your profit target.
🎯 Next Move for Laganikartas: Draw boxes around consolidating NEPSE scrips on your daily chart. Set a price alert slightly above the resistance line so you are instantly notified when the smart money finally makes their upward move. ➡️ Don't get shaken out! Read our deep dive on how to identify Bear Traps and Bull Traps in the share market here.