
In the Nepal Stock Exchange (NEPSE), support levels are often treated like unbreakable concrete floors. Many laganikartas see a stock bouncing off a specific price—like Rs. 500—multiple times and assume it is the perfect, safe place to buy.
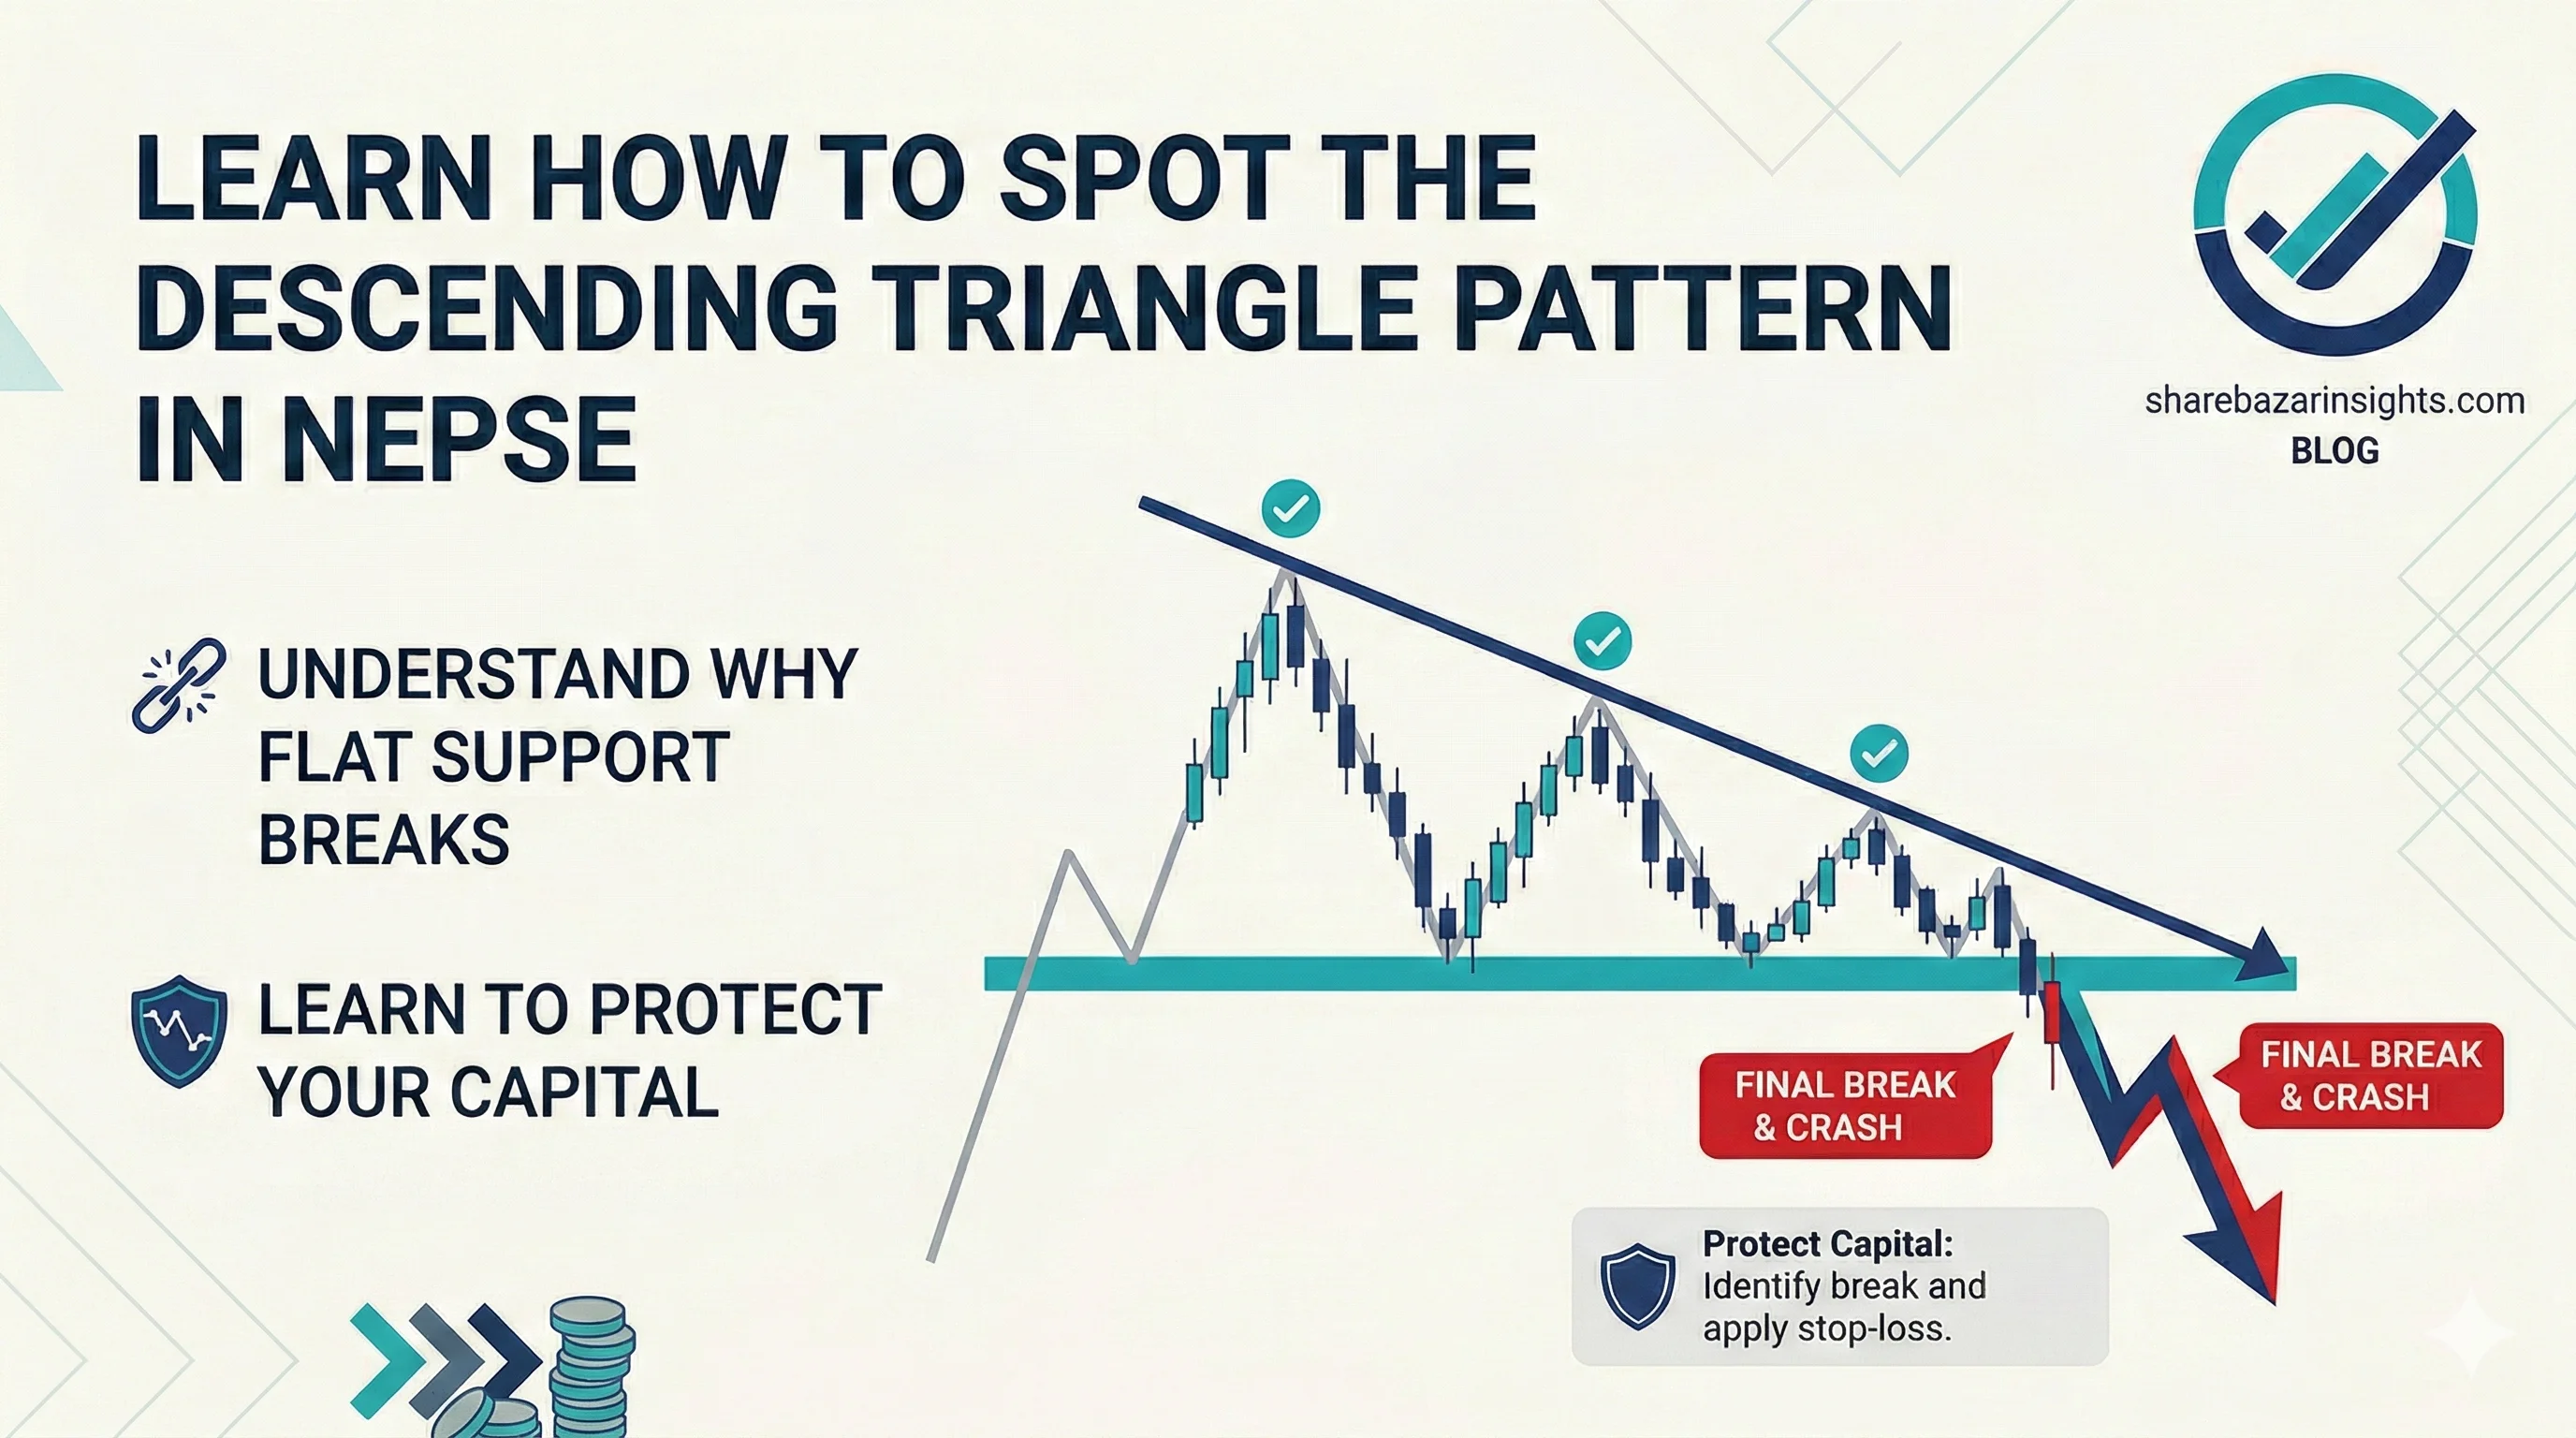
However, if you look closely at the chart and notice that every bounce is getting weaker and lower, that "safe" floor is actually a trap. This forms a Descending Triangle, a powerful bearish continuation pattern that warns investors the floor is about to collapse.
Anatomy of the Descending Triangle
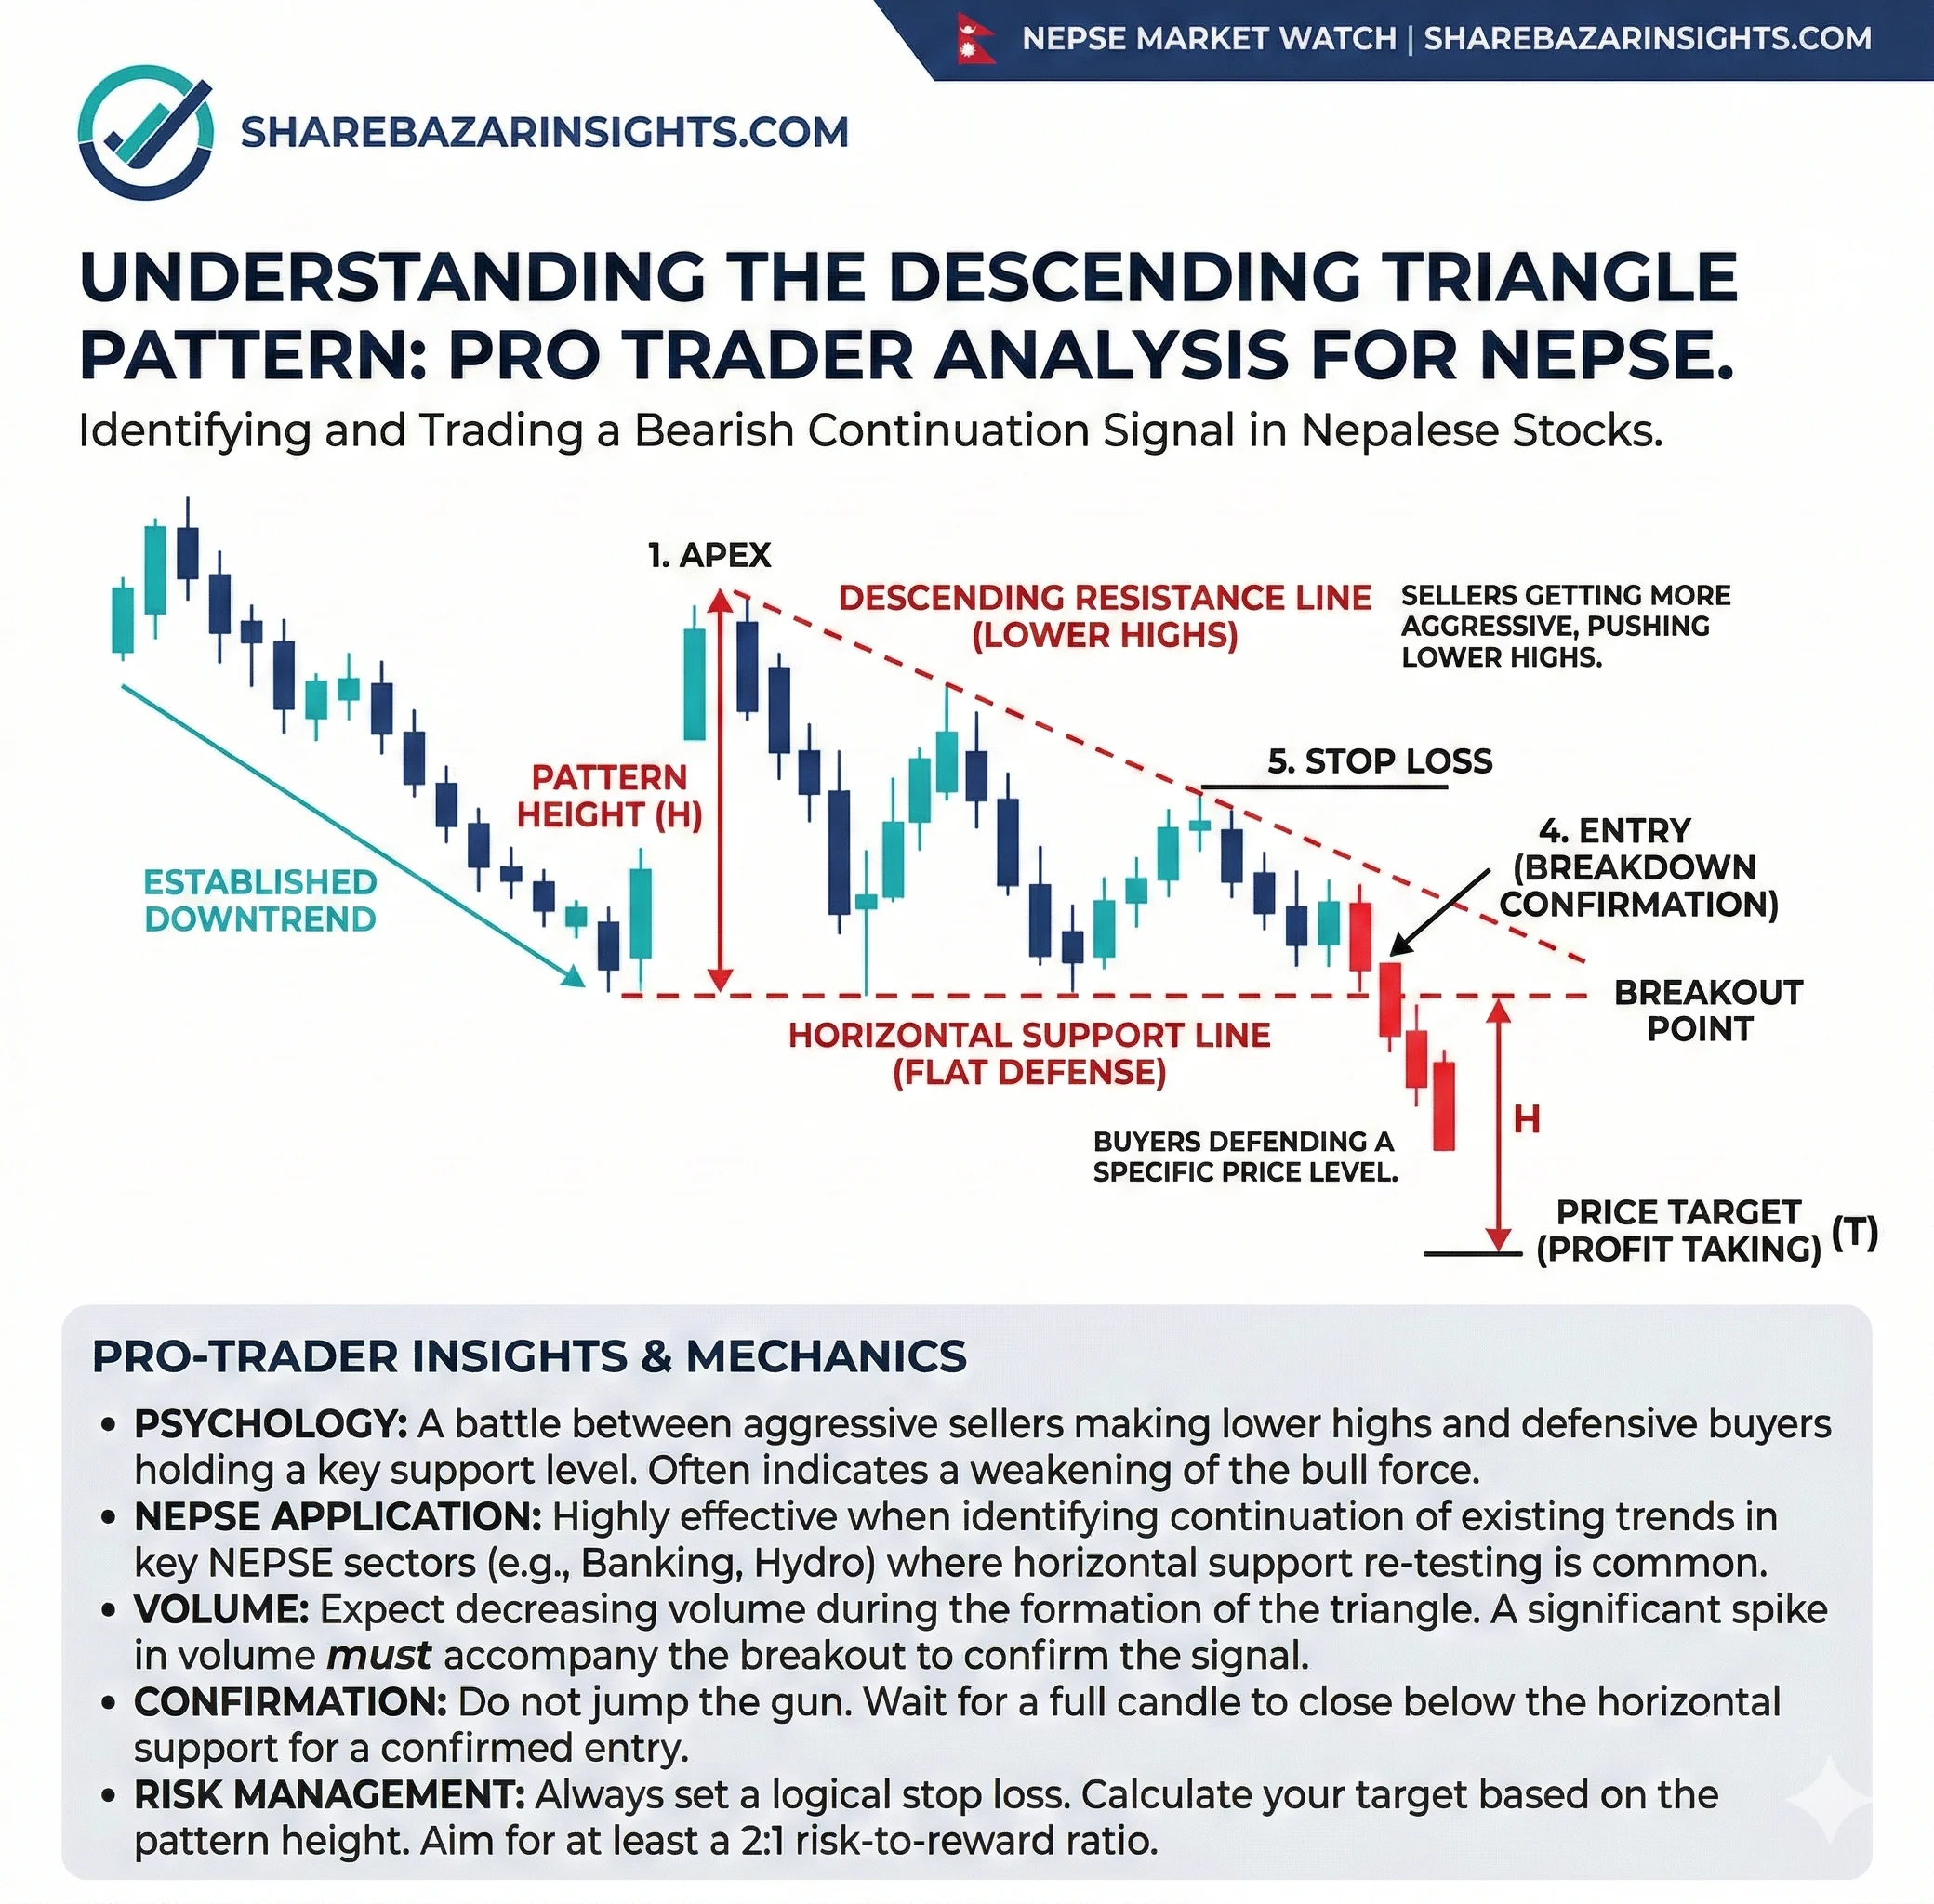
This pattern looks like a right-angled triangle pointing downward. It happens during a larger downtrend and consists of two main lines:
🛑 The Flat Floor (Support): A horizontal lower line connecting two or more lows at the exact same price level. This is where buyers are stubbornly trying to defend the stock.
📉 The Falling Ceiling (Resistance): A downward-sloping upper line connecting a series of lower highs. This shows sellers are stepping in earlier and earlier on every bounce.
🚨 The Breakdown: The space between the floor and the ceiling gets squeezed until the price forcefully breaks below the flat support line.
 The Psychology: Exhausting the Buyers
The Descending Triangle is a slow, painful story of buyer exhaustion.
At first, the buyers have enough capital to defend the flat support line. But the sellers are highly motivated to exit their positions. Because the sellers are so eager, they don't wait for the price to bounce very high—they sell the rips early, creating the falling ceiling.
Every time the sellers smash the price back down to the support level, the buyers have to spend more of their capital to absorb the shares. Eventually, the buyers simply run out of money. The demand vanishes. Once that flat support is broken, it flips into a heavy resistance level, and the stock triggers a fresh wave of panic selling as the trapped buyers finally surrender.
How to Trade It (Protect Your Capital) in NEPSE
🚦 The Exit Signal: Do not wait for the floor to break to start planning your exit. If you see lower highs compressing against a flat support, it is time to get cautious. The absolute final signal to sell is when a daily candle closes cleanly below the flat support line.
📊 Volume Confirmation: The breakdown is usually accompanied by a massive spike in daily turnover, proving that the institutional support is officially gone and panic has set in.
🎯 The Danger Zone: Measure the height of the thickest part of the triangle (the beginning of the pattern). Subtract that measurement from the breakdown price to find out how deep the coming crash will likely be.
🎯 Next Move for Laganikartas: Check your portfolio. Are any of your scrips repeatedly tapping a support line but failing to make higher highs? If so, tighten your stop-loss strictly below that support line. ➡️ Don't get caught holding the bag. Read our guide on strict Stop-Loss strategies for the Nepali market here.