
The Dragonfly Doji in NEPSE: A Powerful Single-Candle Reversal Signal
In the art of technical analysis, few candlestick patterns are as symbolic and thought-provoking as the Doji. To many beginners in the NEPSE, it looks like a simple cross or a “plus sign” on the TMS chart. But for the trained laganikarta, a Doji tells a fascinating story of psychological tug-of-war between buyers and sellers.
While a standard Doji simply means "indecision," there is a highly specific, rare variation that acts as a massive bullish alarm bell: The Dragonfly Doji.
When this unique, "T-shaped" candle appears at the bottom of a NEPSE downtrend, it signals a massive rejection of lower prices and the potential start of a new bull run. Here is exactly how to spot, confirm, and trade the Dragonfly Doji in the Nepali share market.
What is a Dragonfly Doji?
The Dragonfly Doji is a single-candle pattern where the Open, High, and Close prices are all at (or virtually at) the exact same level. Because the body is basically non-existent, the candlestick looks just like a dragonfly, or a capital letter "T".
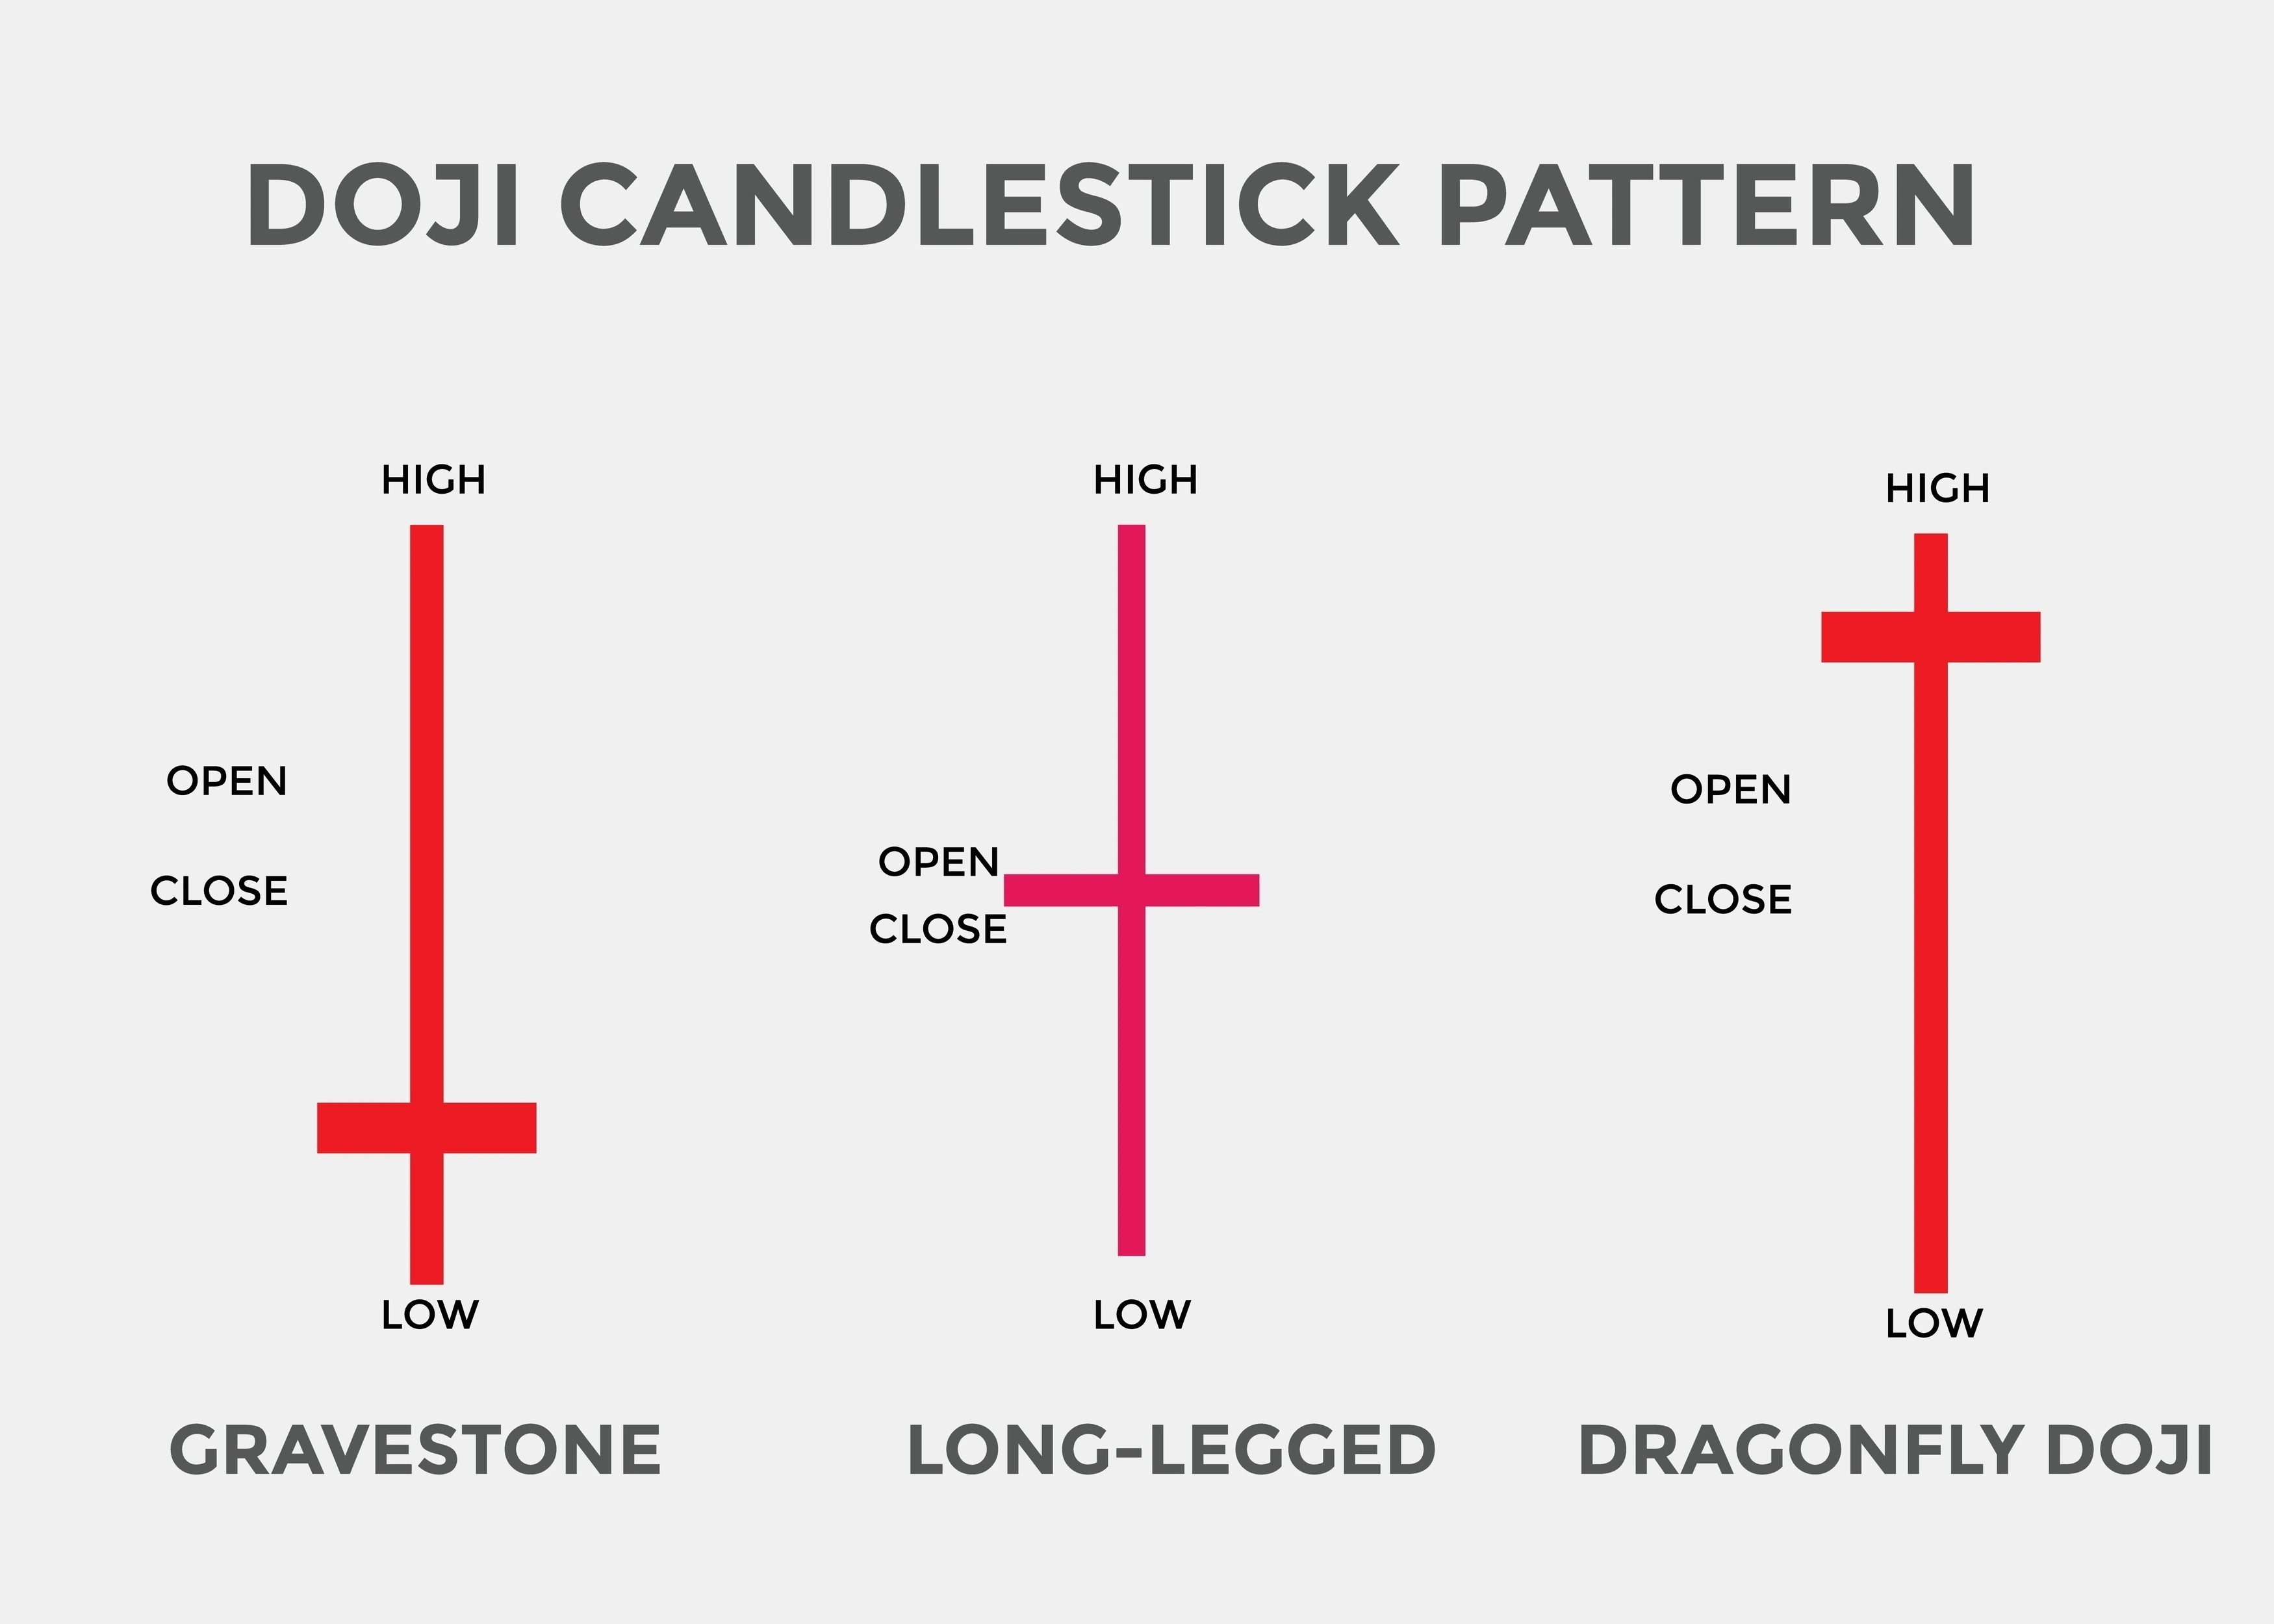
The Anatomy of a Perfect Dragonfly Doji:
The Body: Very small or completely flat. The opening bell price at 11:00 AM and the closing price at 3:00 PM are nearly identical.
The Lower Wick (Shadow): This is the defining feature. The lower wick must be incredibly long—often 3 to 5 times longer than whatever tiny body might exist.
The Upper Wick: There should be absolutely no upper wick (or a microscopic one). The highest price of the day is the same as the open/close.
The Psychology: The Ultimate "Buy the Dip"
To understand why this pattern works in the NEPSE, you have to look at the intraday battle it represents.
Imagine a fundamentally strong stock, like Nabil Bank or a major Hydropower company, has been falling for weeks.
The Bear Attack: The market opens, and sellers instantly dump their kitta. The price crashes deeply, creating that long lower wick. At this point, the bears are in total control.
The Rejection: The price drops so low that it hits a major support zone. Suddenly, institutional buyers, mutual funds, and smart money step in. They realize the stock is at a massive discount.
The Comeback: The influx of buying power is so aggressive that it absorbs all the selling pressure. The bulls push the price all the way back up to the exact point where it opened.
The long lower shadow is the footprint of the bulls. It shows that even though the bears tried their hardest to crash the price, the buyers completely wiped out their progress by the closing bell.
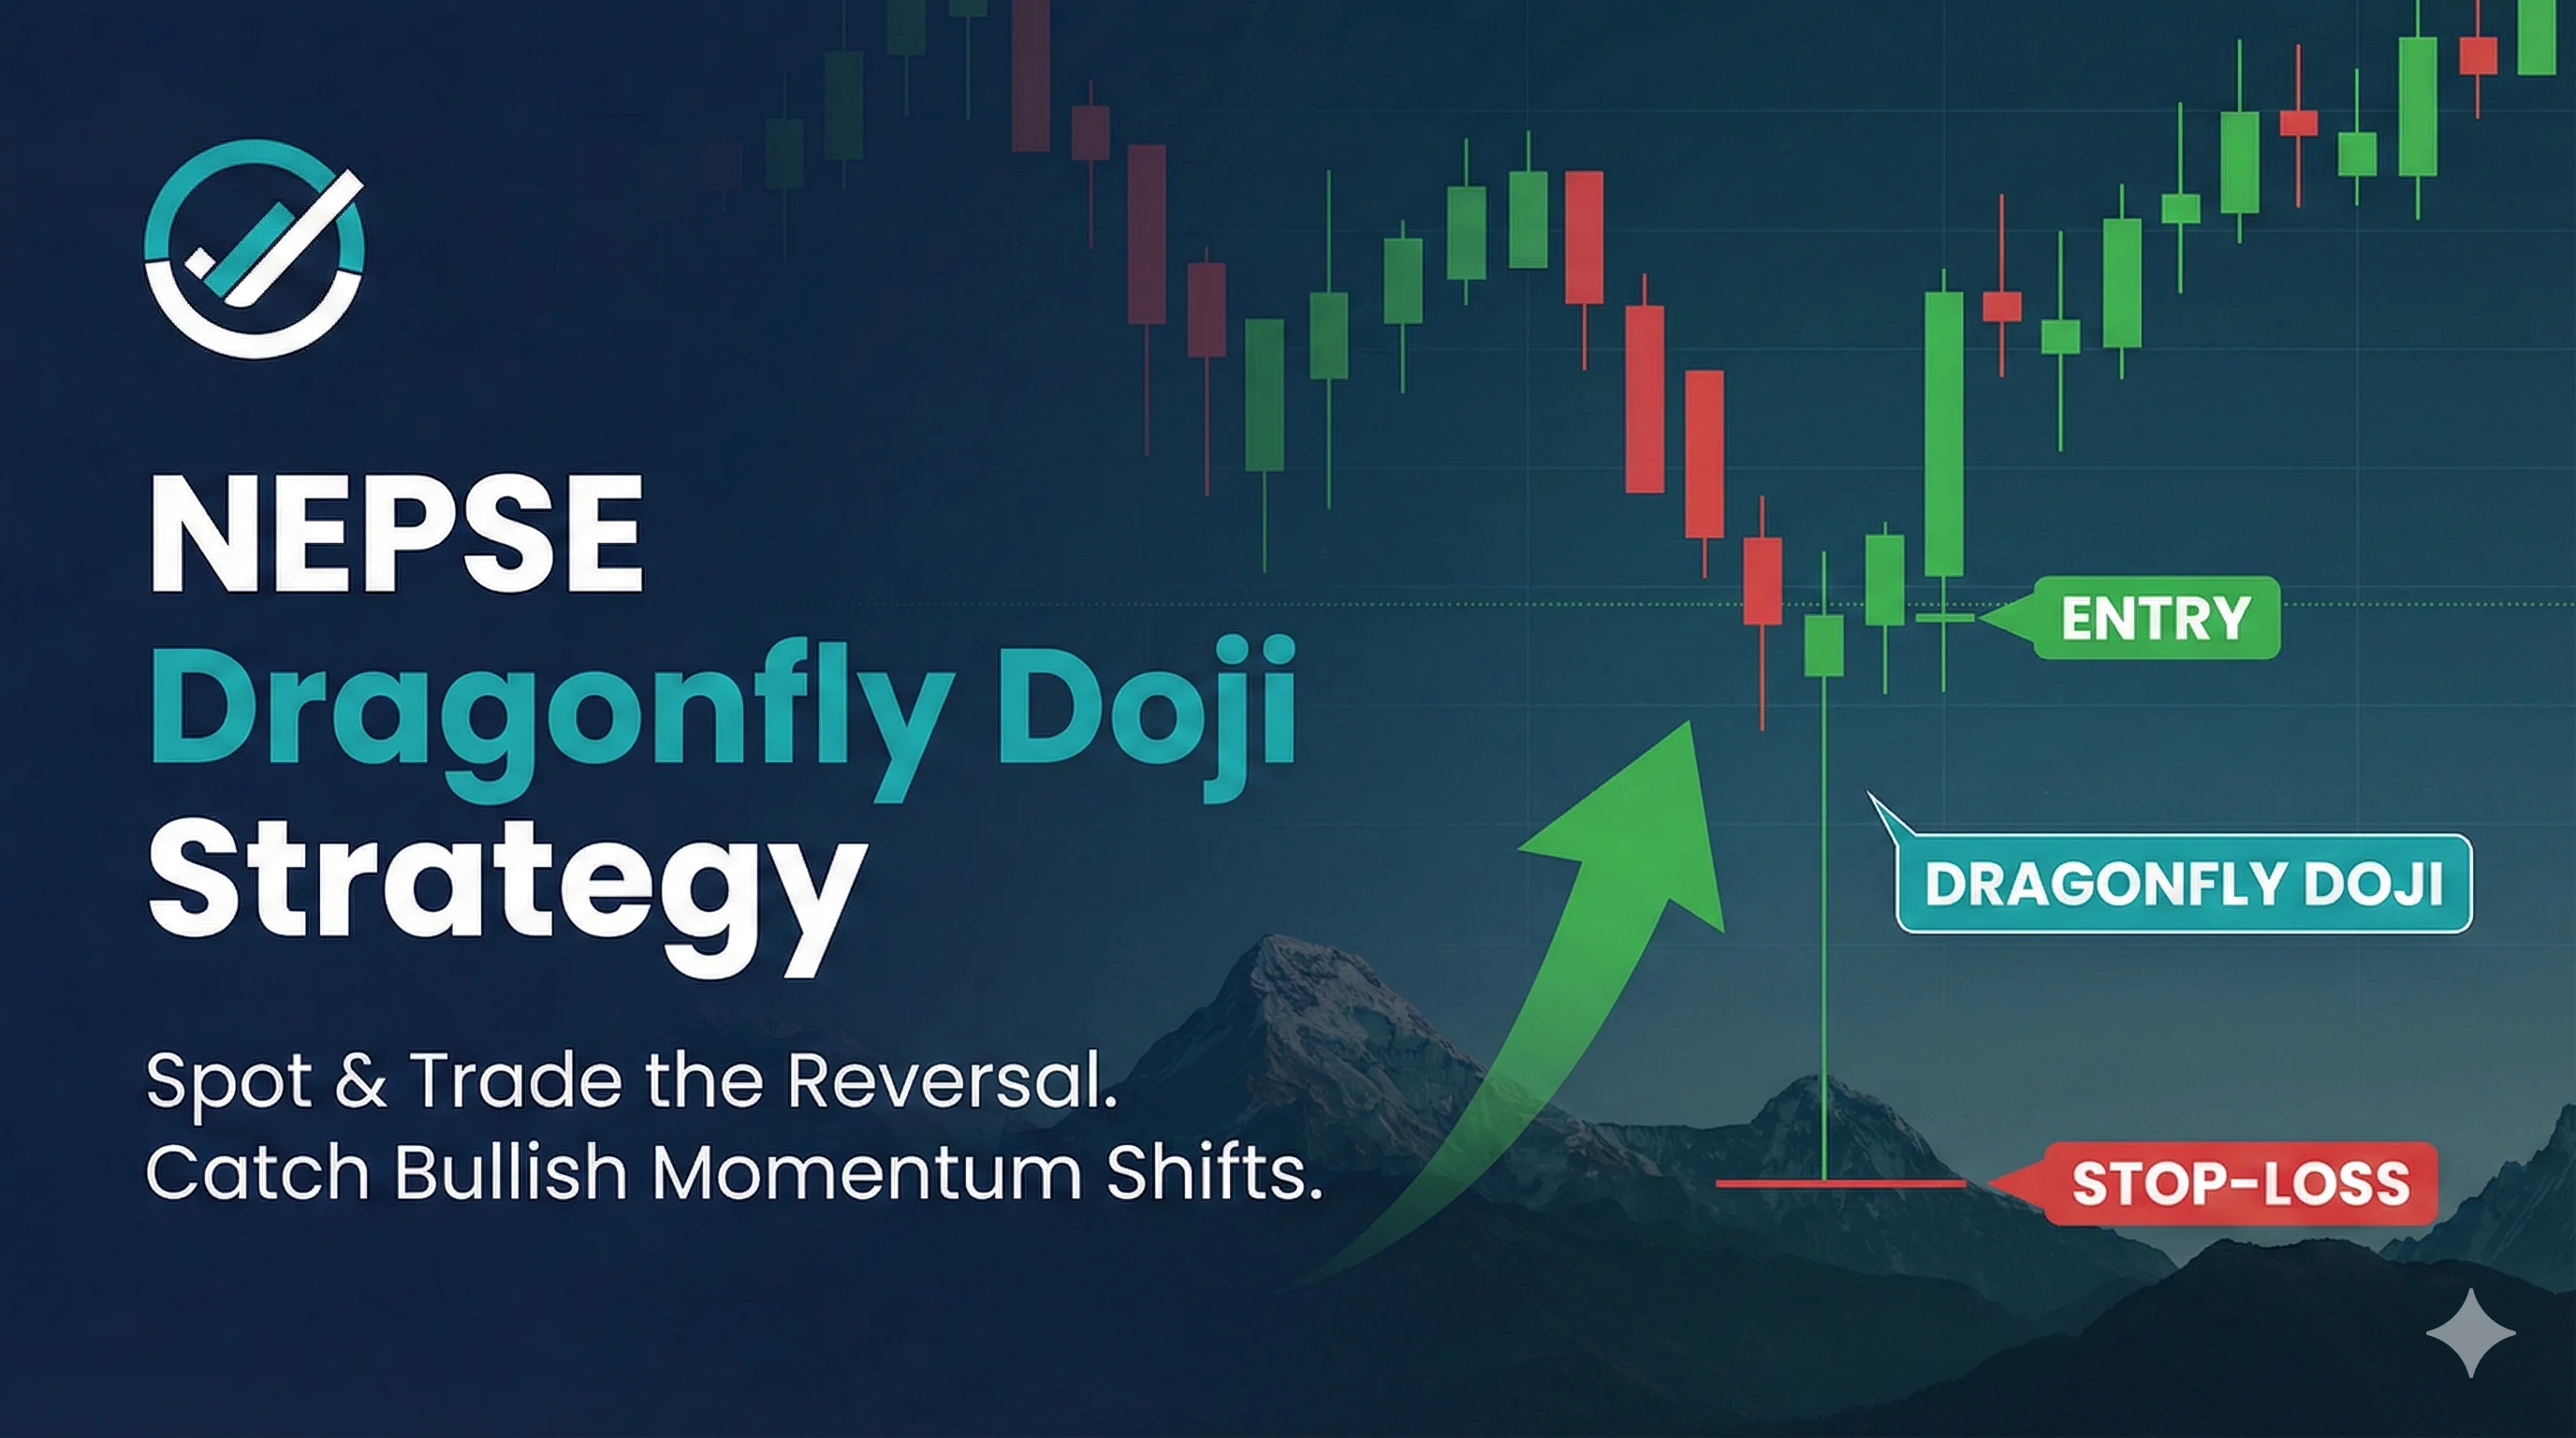
How to Trade the Dragonfly Doji in NEPSE
The Dragonfly Doji is powerful, but trading it blindly is a recipe for disaster. Context is everything. Here is your step-by-step trading plan:
Step 1: Check the Trend and Location A Dragonfly Doji in a sideways, ranging market is meaningless—it will just lead to false breakouts. It must appear after a clear, sustained downtrend. The pattern is highly reliable when it forms near:
The 200-day or 50-day Moving Average.
A major psychological support level (e.g., the NEPSE index bouncing off exactly 2,000 or 2,500).
An oversold RSI (Relative Strength Index).
Step 2: Wait for Confirmation (Crucial!) Experienced traders do not enter a trade on the same day the Doji forms. You must wait for the next trading day. For a bullish reversal to be confirmed, the candle following the Dragonfly Doji must be a strong green candle that closes above the Doji's Open/Close level.
Step 3: Analyze the Volume A sudden reversal needs fuel. Check your NEPSE Alpha or regular charting tool to see the volume. An accompanying surge in trading volume on the day of the Doji—and especially on the confirmation day—validates that institutional money is actually supporting the reversal.
Step 4: Execute with Risk Management
Entry: Buy near the close of the confirmation candle, or if you are aggressive, buy right as the price breaks above the Doji's high.
Stop-Loss: Place your strict stop-loss just a few rupees below the absolute lowest point of the Dragonfly's long lower wick. If the price breaks below that, the pattern is dead.
Target: Look for the next major resistance level, aiming for a 1:2 or 1:3 Risk-to-Reward ratio.
Dragonfly Doji vs. The Hammer
You might be thinking, "Wait, this sounds exactly like a Hammer candlestick!" You are correct—they both signal a rejection of lower prices. The difference is purely visual: a Hammer has a thick, visible real body, while a Dragonfly Doji has almost no body at all. Because the Doji requires the Open and Close to be exactly the same, it is much rarer than a Hammer, and therefore, often considered a slightly stronger signal of market indecision shifting abruptly to bullish conviction.