
In the Nepal Stock Exchange (NEPSE), watching a stock you own steadily climb is a great feeling. But no uptrend lasts forever. Knowing exactly when the big players are quietly exiting the market is the key to protecting your portfolio.
One of the most famous, reliable, and heavily watched warning signs in technical analysis is the Head and Shoulders pattern. When this forms at the top of a NEPSE bull run, it is a massive red flag that the buyers are losing their grip and a sharp sell-off is imminent.
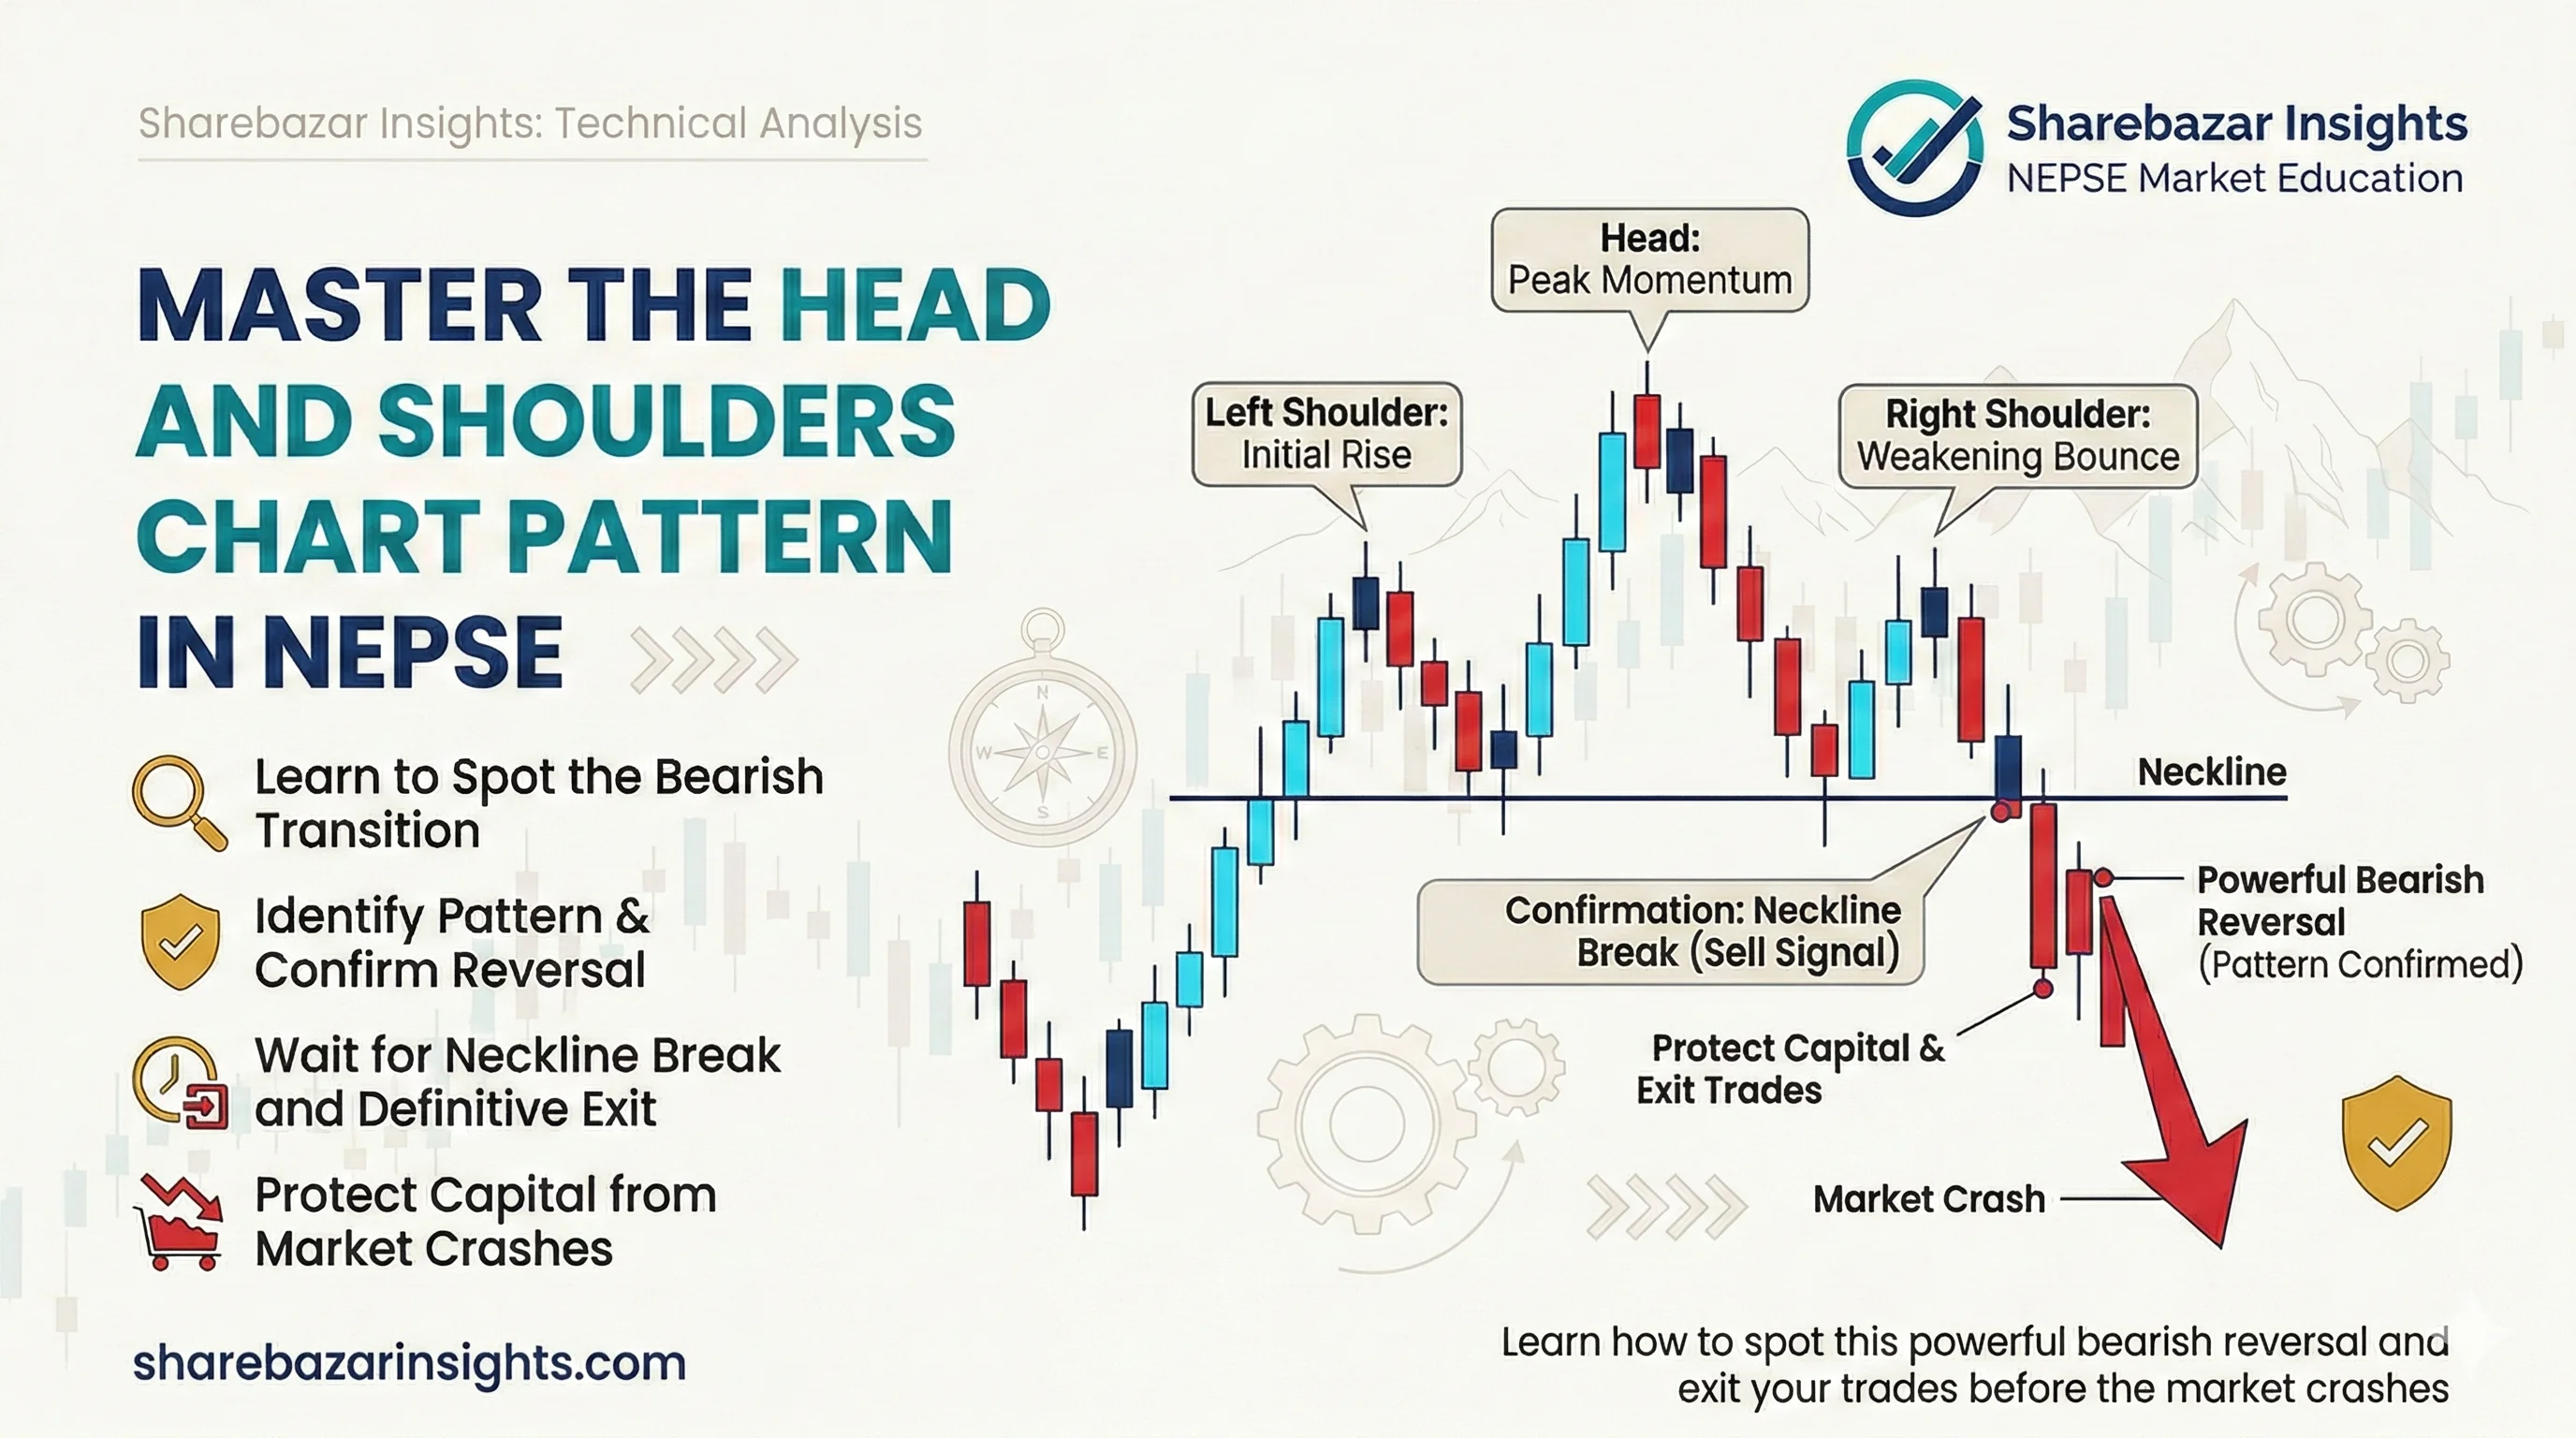
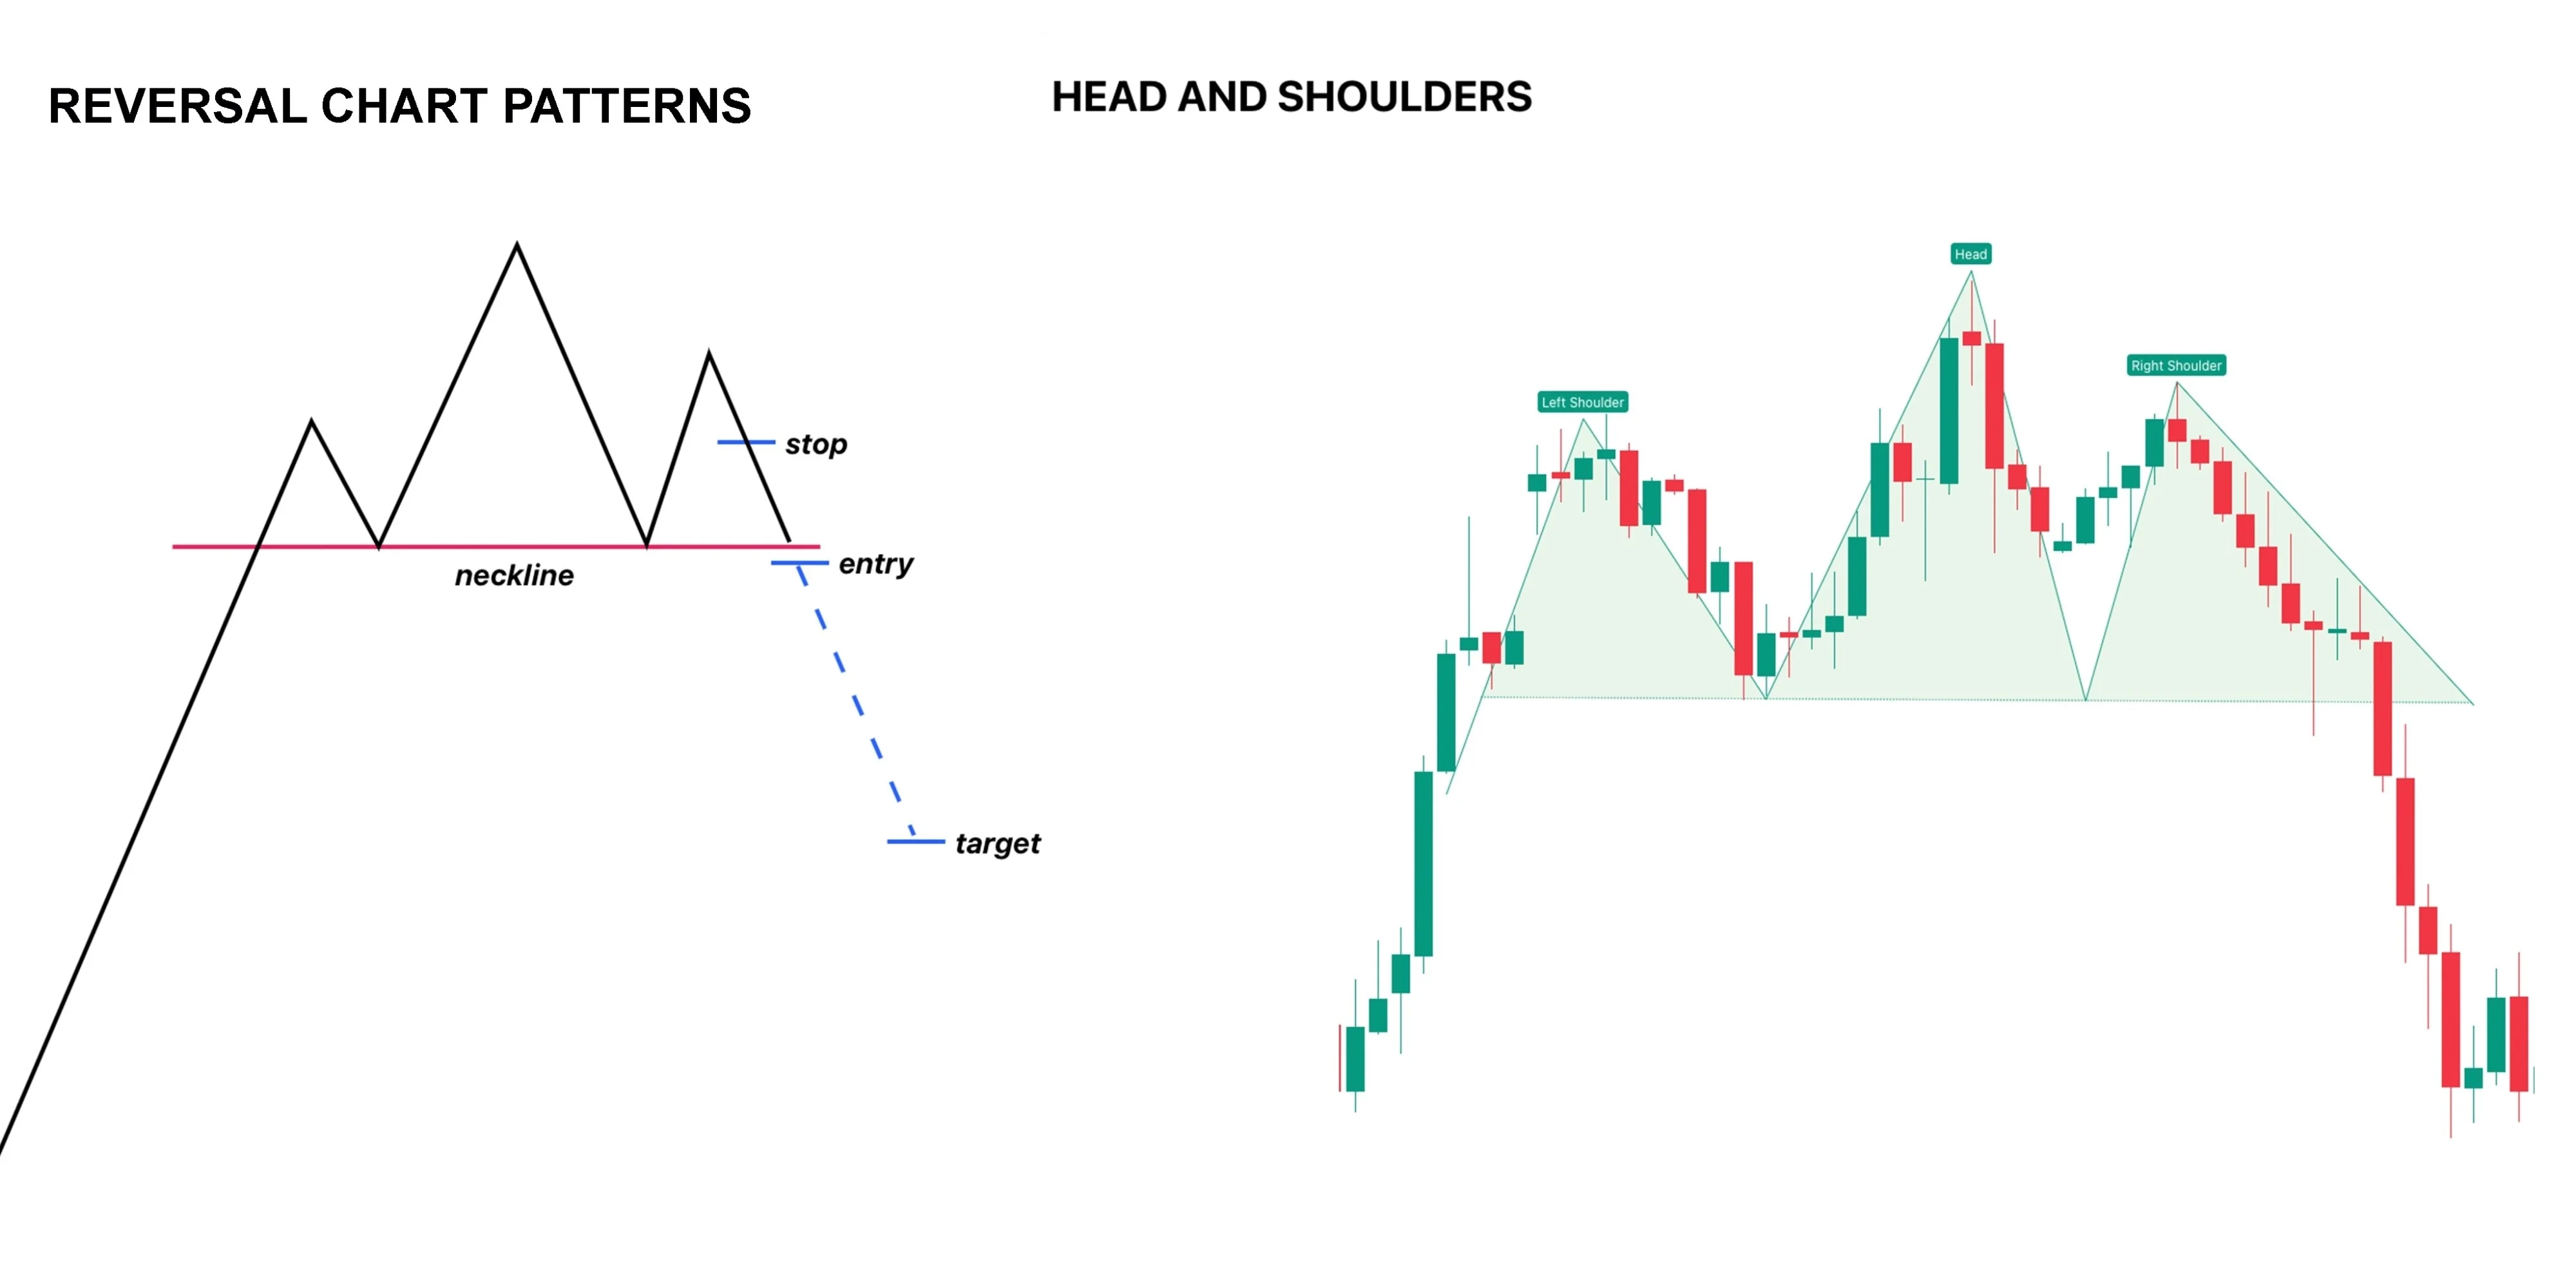
Anatomy of the Head and Shoulders
This bearish reversal pattern visually resembles a person's head and shoulders, playing out in three distinct phases:
The Left Shoulder: The stock is in a strong uptrend. It hits a new high, faces natural profit-booking, and pulls back to establish a baseline support called the "neckline."
The Head: Buyers rush back in, pushing the price past the Left Shoulder to create an even higher peak (the Head). However, selling pressure returns, forcing the price all the way back down to the neckline.
The Right Shoulder: Buyers make one last, desperate attempt to push the price up. Crucially, they fail to reach the height of the Head. The price forms a lower high (the Right Shoulder) and drops back to the neckline.
 The Psychology: The Lower High of Doom
To understand why this pattern works so well in NEPSE, you have to look at the Right Shoulder.
During a healthy bull market, a stock makes higher highs and higher lows. The Left Shoulder and the Head perfectly follow this rule. But the Right Shoulder breaks it. The fact that the buyers couldn't push the price back to the previous high proves they are exhausted.
Institutional investors who bought at the bottom are using these smaller bounces to distribute (sell) their remaining shares to overly optimistic retail laganikartas. Once that Right Shoulder forms, the market sentiment officially shifts from greed to fear.
How to Trade It (Protect Your Capital) in NEPSE
Since you cannot short-sell, your goal is to exit your position before the stock plummets:
🚦 The Exit Signal: The pattern is not confirmed until a daily candlestick closes decisively below the neckline. That breakdown is your absolute signal to hit the sell button.
📊 Volume Clues: You want to see volume drying up as the Head and Right Shoulder form. If the breakdown below the neckline happens on huge trading volume, it guarantees that institutional sellers are dumping their shares.
🎯 The Danger Zone: How deep will the crash go? Measure the vertical distance from the top of the Head down to the neckline. Subtract that distance from the breakout point. This is the minimum drop you are saving yourself from by exiting early.
🎯 Next Move for Laganikartas: Draw the neckline as soon as you spot a potential Head and Shoulders. If you are holding the stock, tighten your stop loss just below that line and prepare to move to cash.