
In the Nepal Stock Exchange (NEPSE), making money during a bull run is only half the battle. Keeping that money when the trend reverses is what separates professional laganikartas from amateurs. Because we cannot short-sell in our market to profit from falling prices, recognizing when an uptrend is dying is critical for capital protection.
One of the most reliable warning signs that a stock is about to crash is the Double Top chart pattern. Often called the "M" pattern, it signals that the buyers are exhausted, the ceiling is too heavy, and a sharp downtrend is coming.
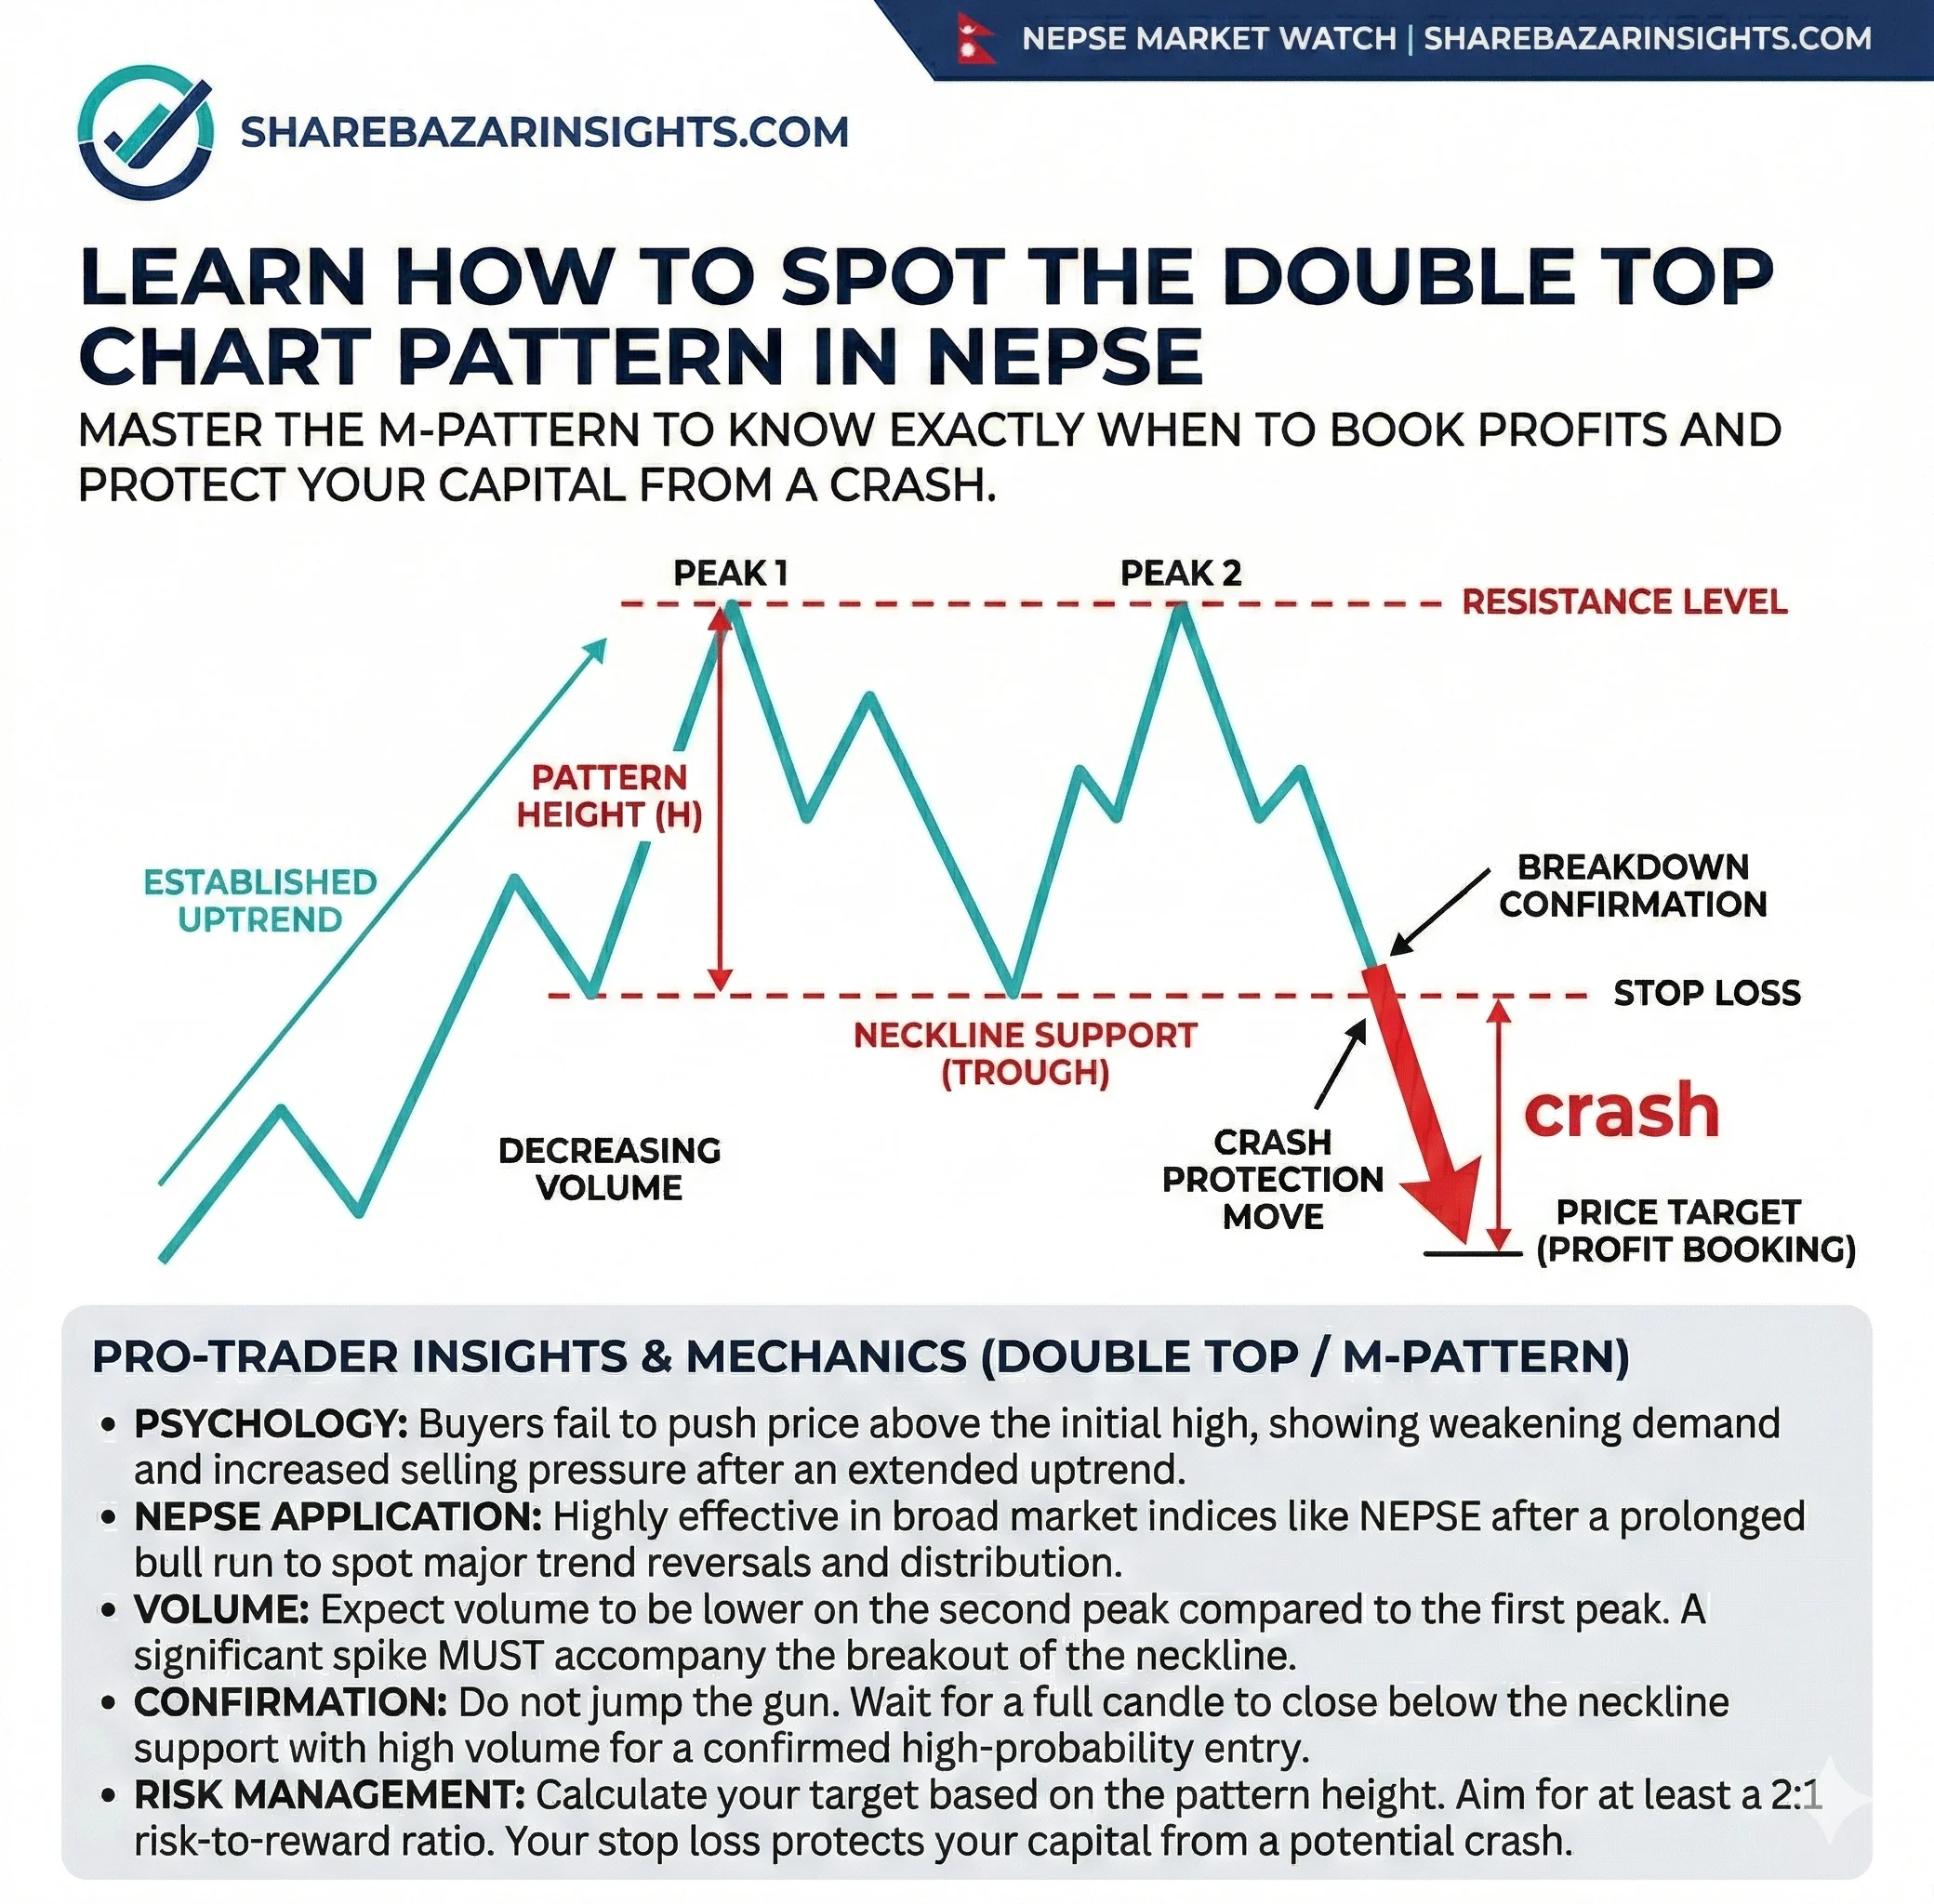
Anatomy of a Double Top
A Double Top is a highly watched bearish reversal pattern that forms at the absolute peak of an uptrend. Here is how it develops:
📈 The First Top: The stock is rallying hard and hits a new high, but faces natural profit-booking. The price drops slightly, establishing a firm support level called the "neckline."
📉 The Second Top: Buyers regroup and try to push the price up again, but they hit a brick wall at the exact same price as the First Top.
🛑 The Rejection: The price fails to break the ceiling and starts falling back toward the neckline.
🚨 The Breakdown: The price drops completely below the neckline, confirming the pattern and triggering a major sell-off.
The Psychology: The Fear of a New Low
Think about the psychology of the buyers trapped at the top. When the stock drops from its first peak, they hold on, hoping the uptrend will resume. But when the price rallies a second time and utterly fails to break the resistance, reality sets in.
They realize the big institutional players are distributing (selling) their shares. Fear takes over. Knowing that the stock is likely going to make a new low, everyone rushes to hit the "Sell" button at the same time to protect whatever capital they have left. This massive rush to the exit is what causes the sharp breakdown.
How to Trade It (Protect Your Capital) in NEPSE
In NEPSE, you trade this pattern by selling to lock in profits or cutting your losses to avoid getting trapped in a long-term downtrend:
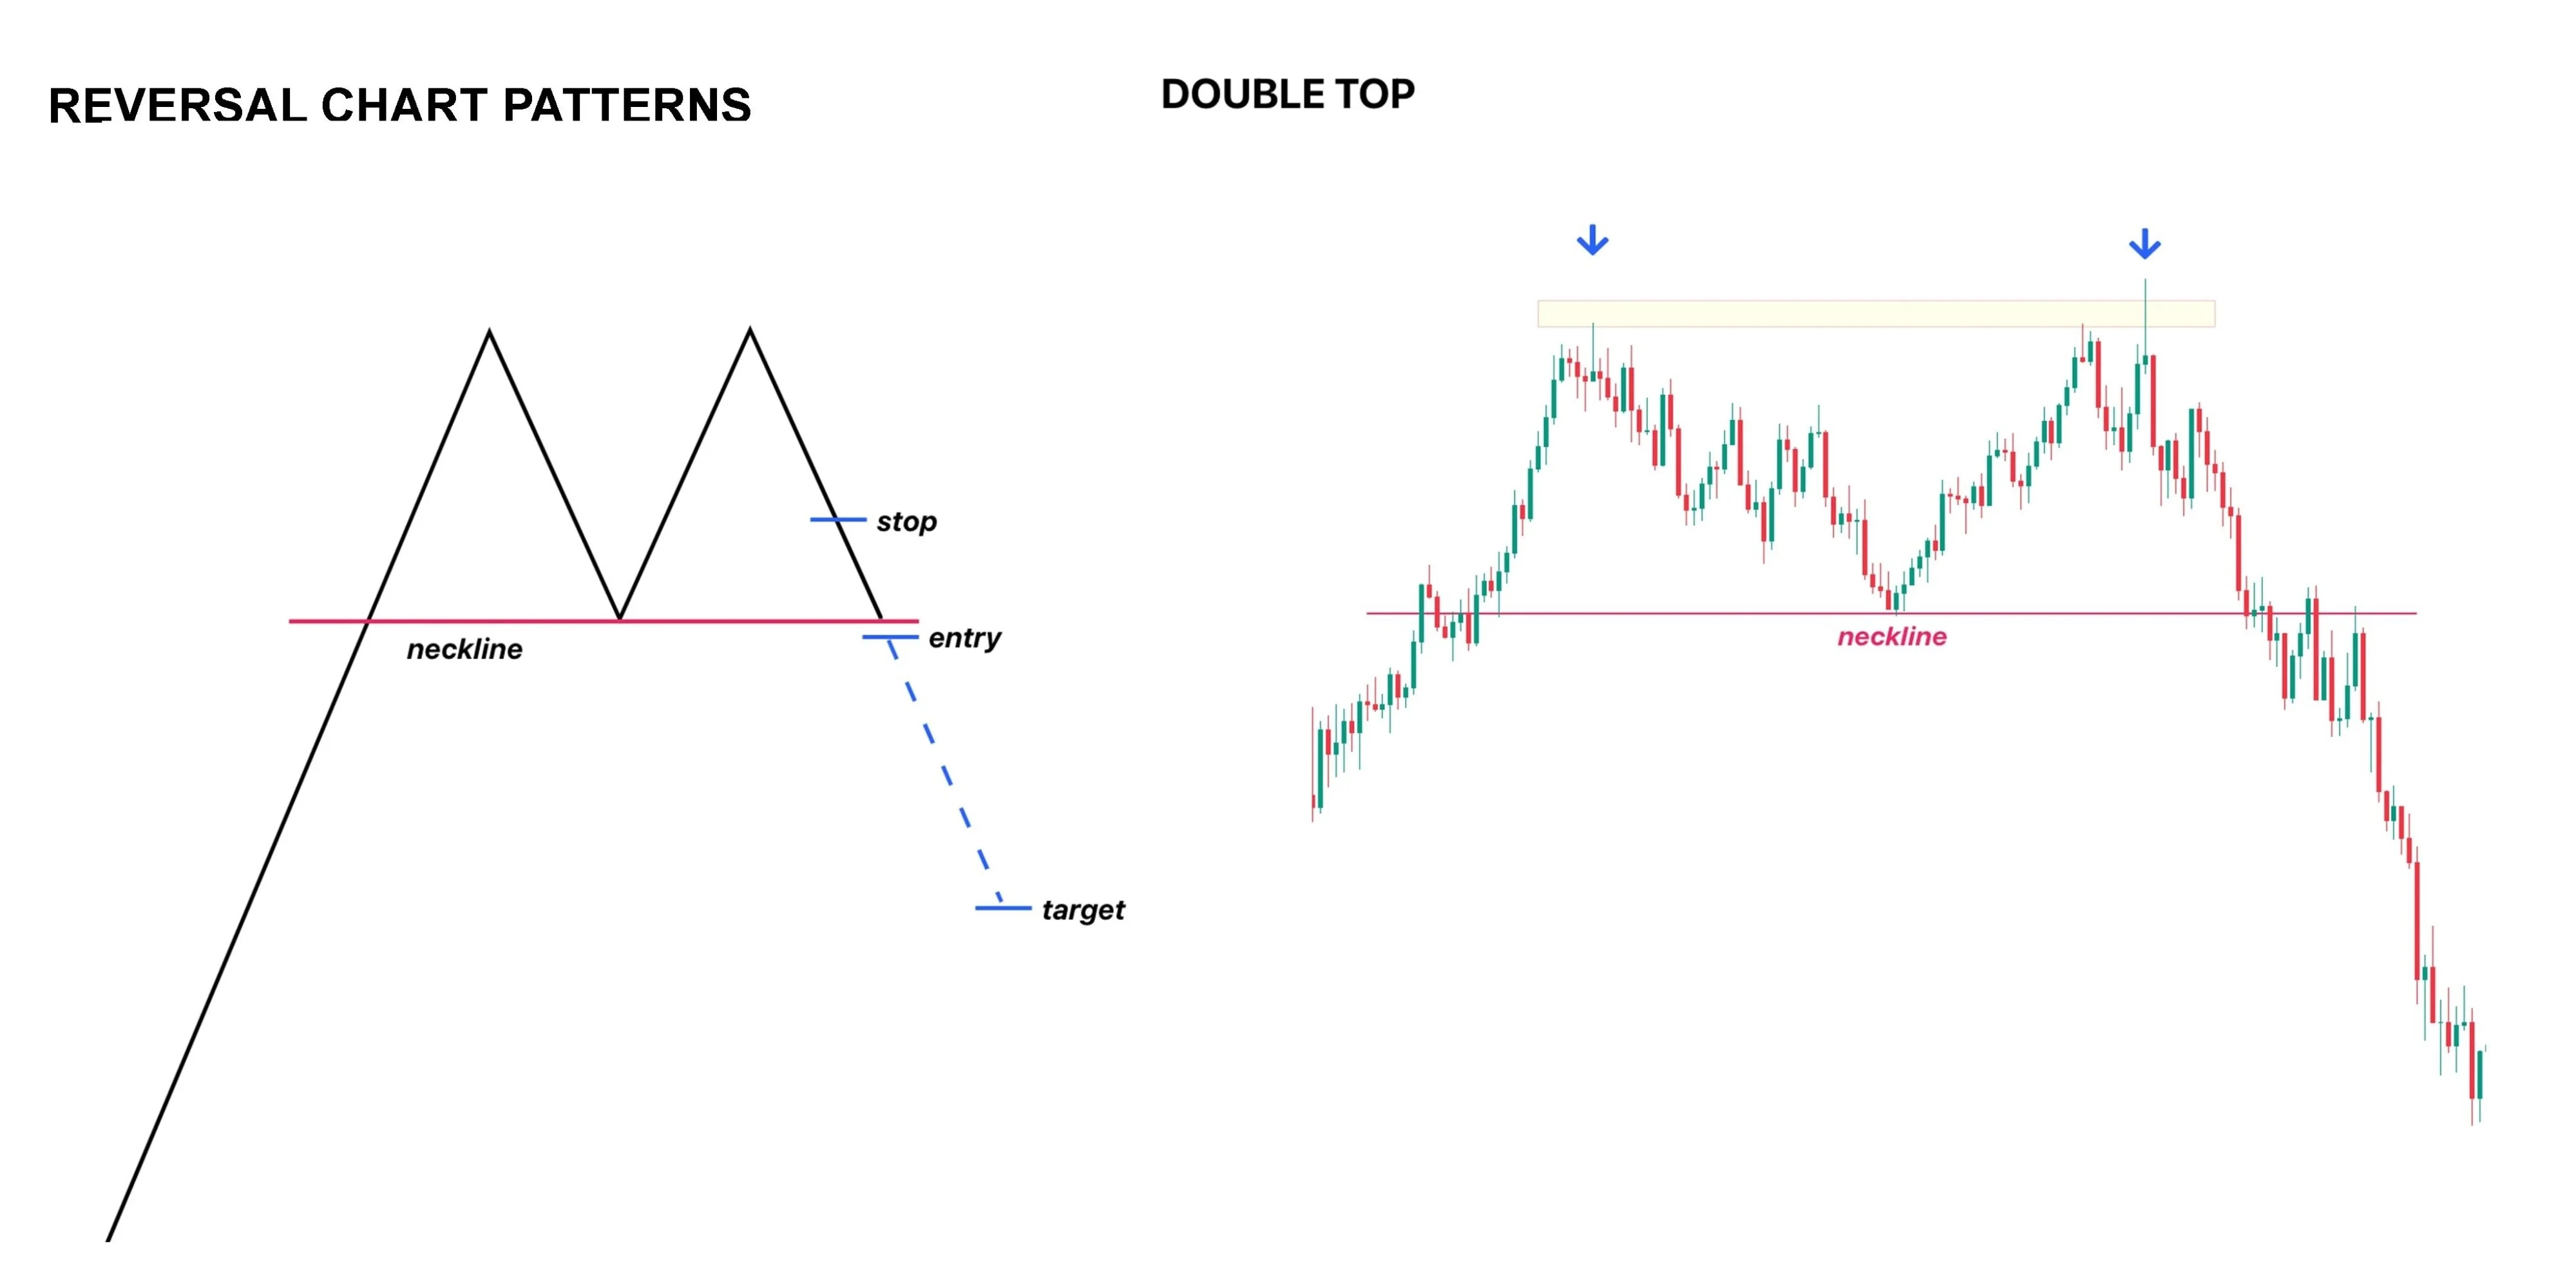
🚦 The Exit Signal: Do not panic-sell just because the price hits the second top. The pattern is only confirmed when a daily candlestick completely closes below the neckline. That breakdown is your definitive signal to exit.
📊 Watch the Turnover: Pay close attention to NEPSE trading volume. If the volume is lower on the second top than on the first top, it proves the buyers are losing strength. A high-volume breakdown below the neckline guarantees the smart money is leaving.
🎯 The Danger Zone: If you ignore the breakdown, how far can the stock fall? Measure the distance between the top peaks and the neckline. Subtract that exact distance from the neckline breakdown point to see the minimum downside target.
🎯 Next Move for Laganikartas: Never fall in love with a stock. If your favorite NEPSE scrip forms an "M" shape and breaks its neckline, respect the chart, book your profits, and wait safely in cash for a better buying opportunity.