
In technical analysis, a single day of green in the TMS doesn't always mean the bear market is over. Sometimes, laganikartas need a more structured, confirmed signal that the selling has truly exhausted itself.
Enter the Morning Star Pattern.
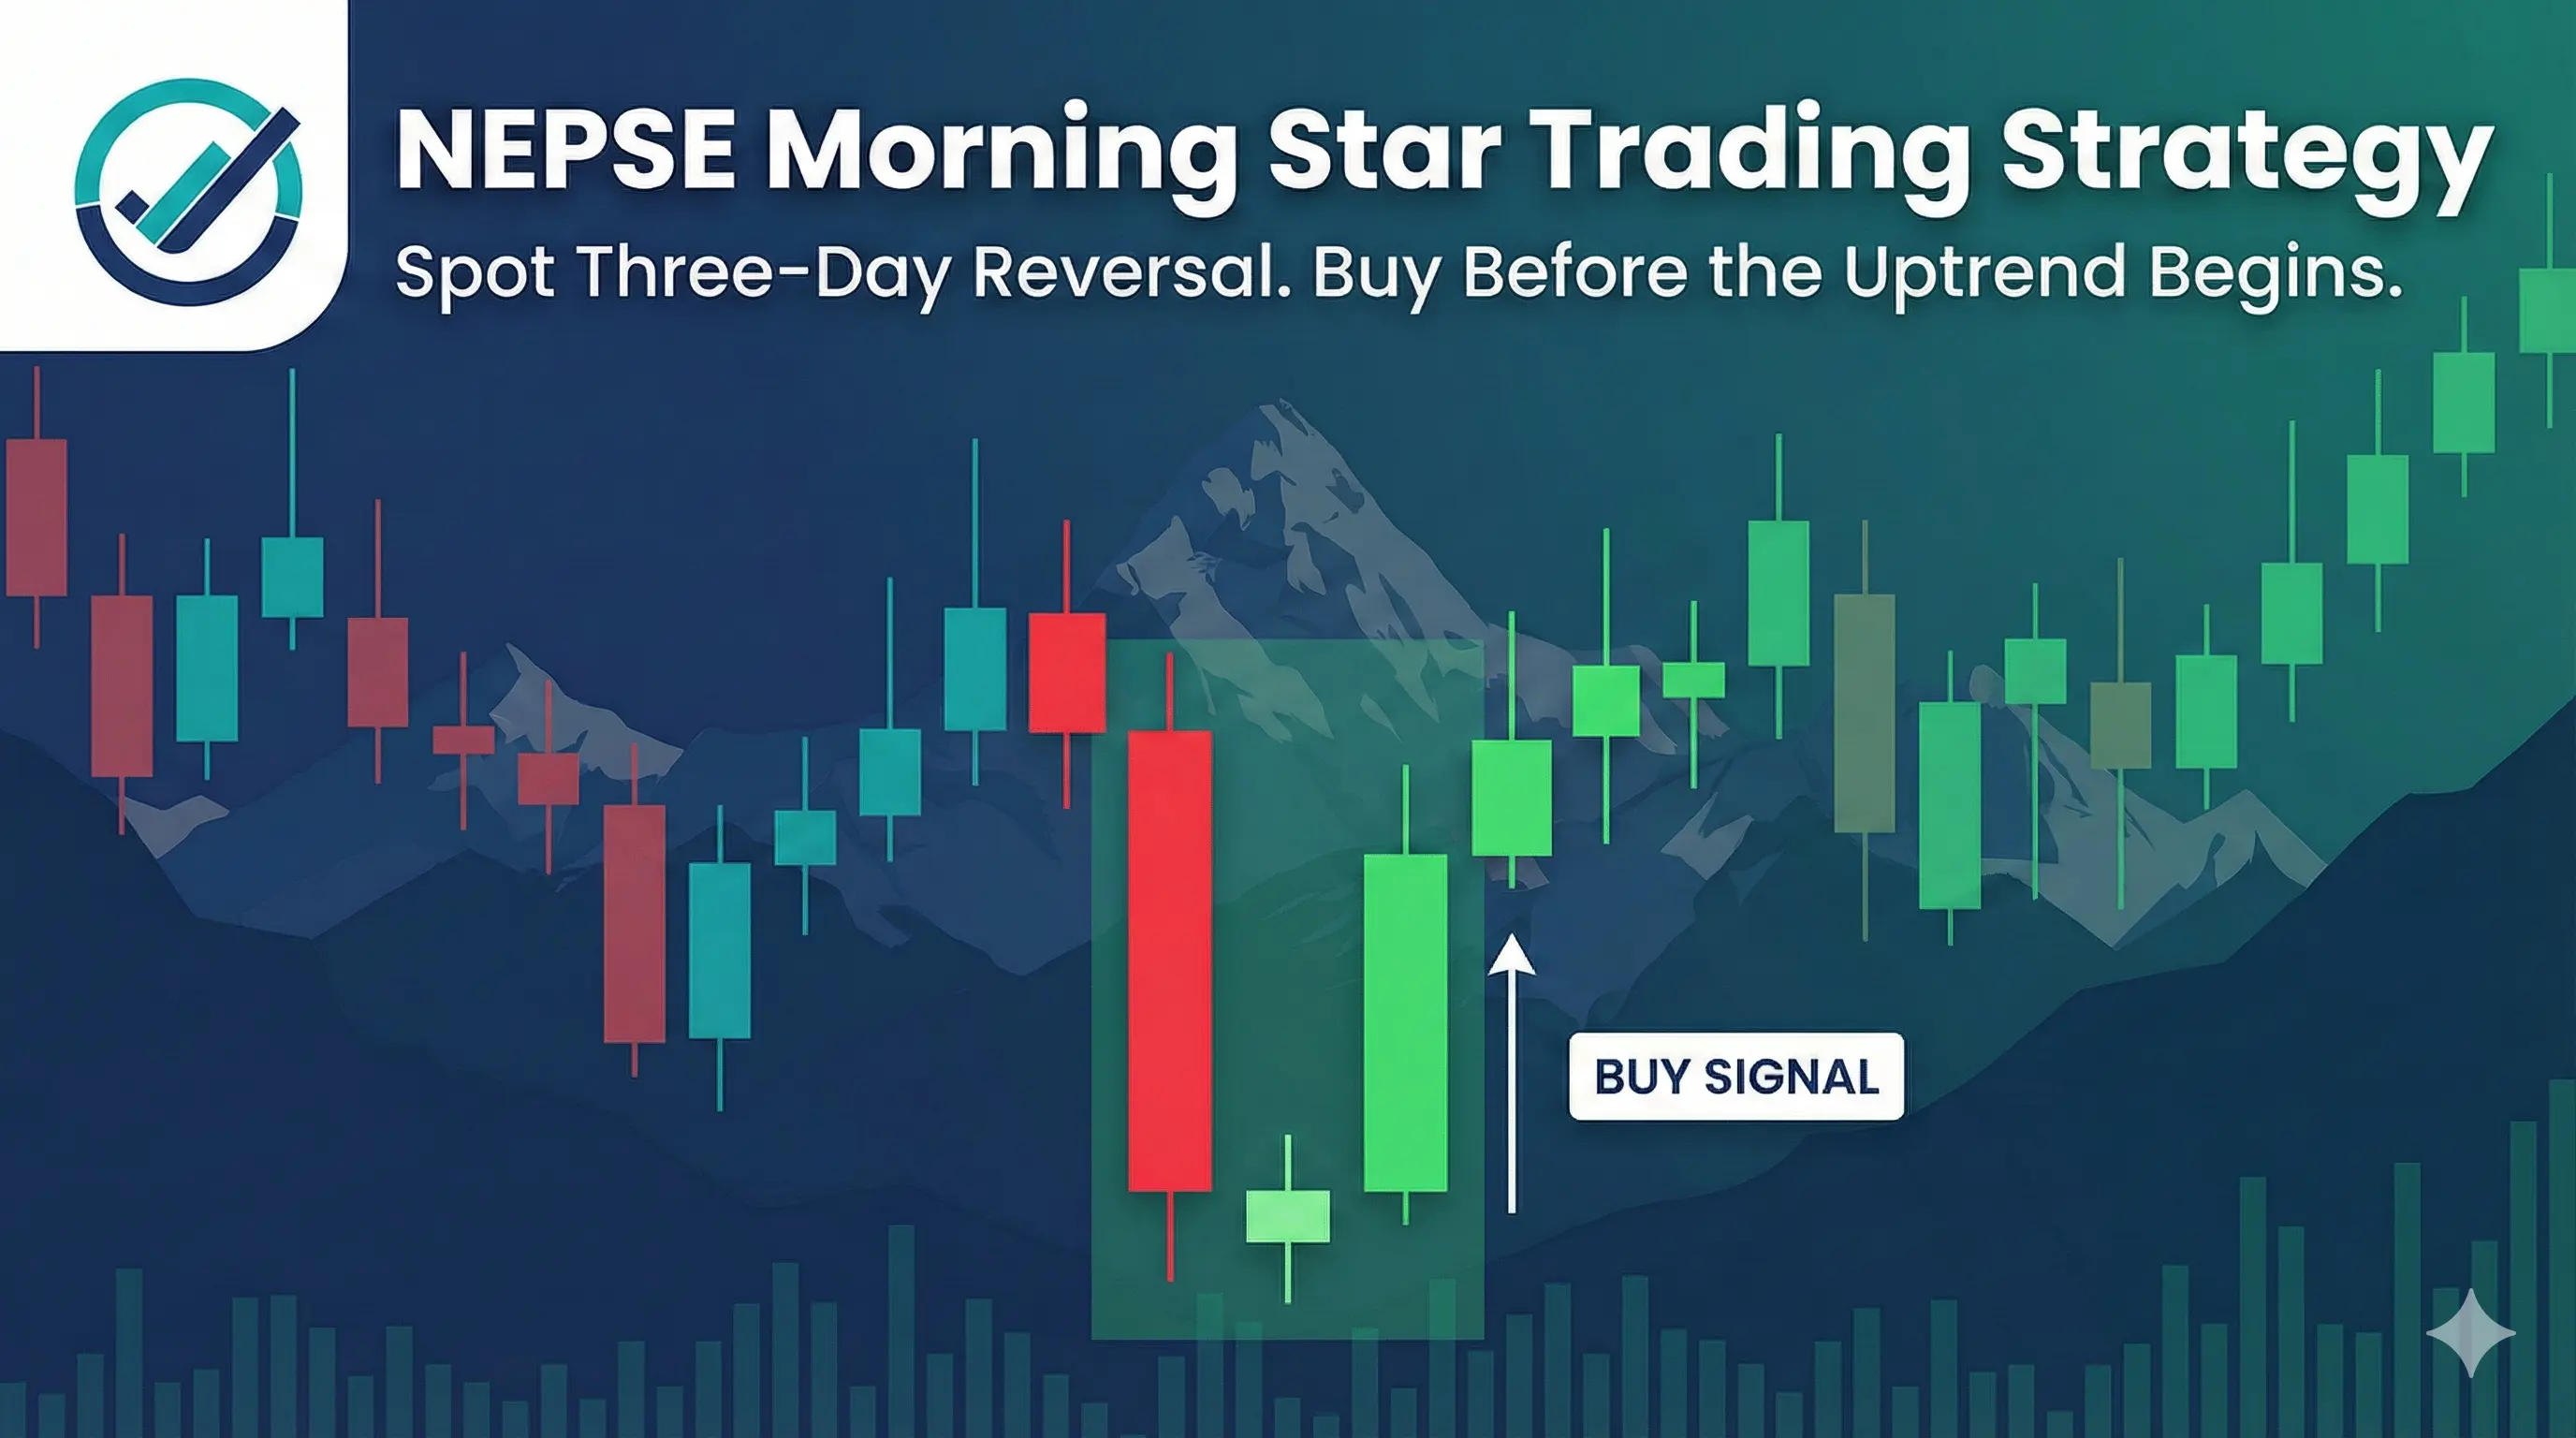
Just like the morning star (the planet Venus) appears in the sky right before sunrise to signal the end of the dark night, this three-candle formation appears at the very bottom of a downtrend to signal the dawn of a new bull run. It is one of the most trusted and reliable reversal setups in the Nepali share market. Here is how to master it.
What is a Morning Star Pattern?
The Morning Star is a multi-day reversal pattern. Because it unfolds over three full trading sessions, it provides a much clearer picture of shifting market psychology than single-candle patterns like the Hammer.
 The Anatomy of a Perfect Morning Star:
Candle 1 (Day 1): A strong, long red (bearish) candle. The market is still in a clear downtrend, and panic sellers are firmly in control.
Candle 2 (Day 2): A small-bodied candle (it can be green, red, or a Doji). It typically opens with a gap-down. This is the "Star." It shows that the bears tried to push the price lower, but the momentum died completely, leading to a day of indecision.
Candle 3 (Day 3): A strong, long green (bullish) candle. It often opens with a gap-up and must close well into the body of Day 1's red candle (ideally past the 50% midpoint). This proves the bulls have taken over.
The Psychology: The Dawn of a New Uptrend
Let's look at how a Morning Star develops on a popular NEPSE commercial bank or insurance stock.
The Final Flush (Day 1): The index has been bleeding for weeks. Retail investors capitulate and dump their kitta at huge losses. The red candle is large, showing maximum bearish momentum.
The Standoff (Day 2): The market opens even lower, but the heavy selling suddenly stops. Smart money starts quietly accumulating shares at the bottom. The tight trading range (the small body) shows that supply and demand have temporarily balanced out.
The Takeover (Day 3): The institutional buyers (kheladis) step on the gas. Buying pressure overwhelms whatever is left of the sellers. The price surges upward, trapping all the short-term bears and officially sparking the reversal.
How to Trade the Morning Star in NEPSE
The beauty of the Morning Star is that Day 3 is the confirmation. By the time the pattern is complete, the reversal is already verified.
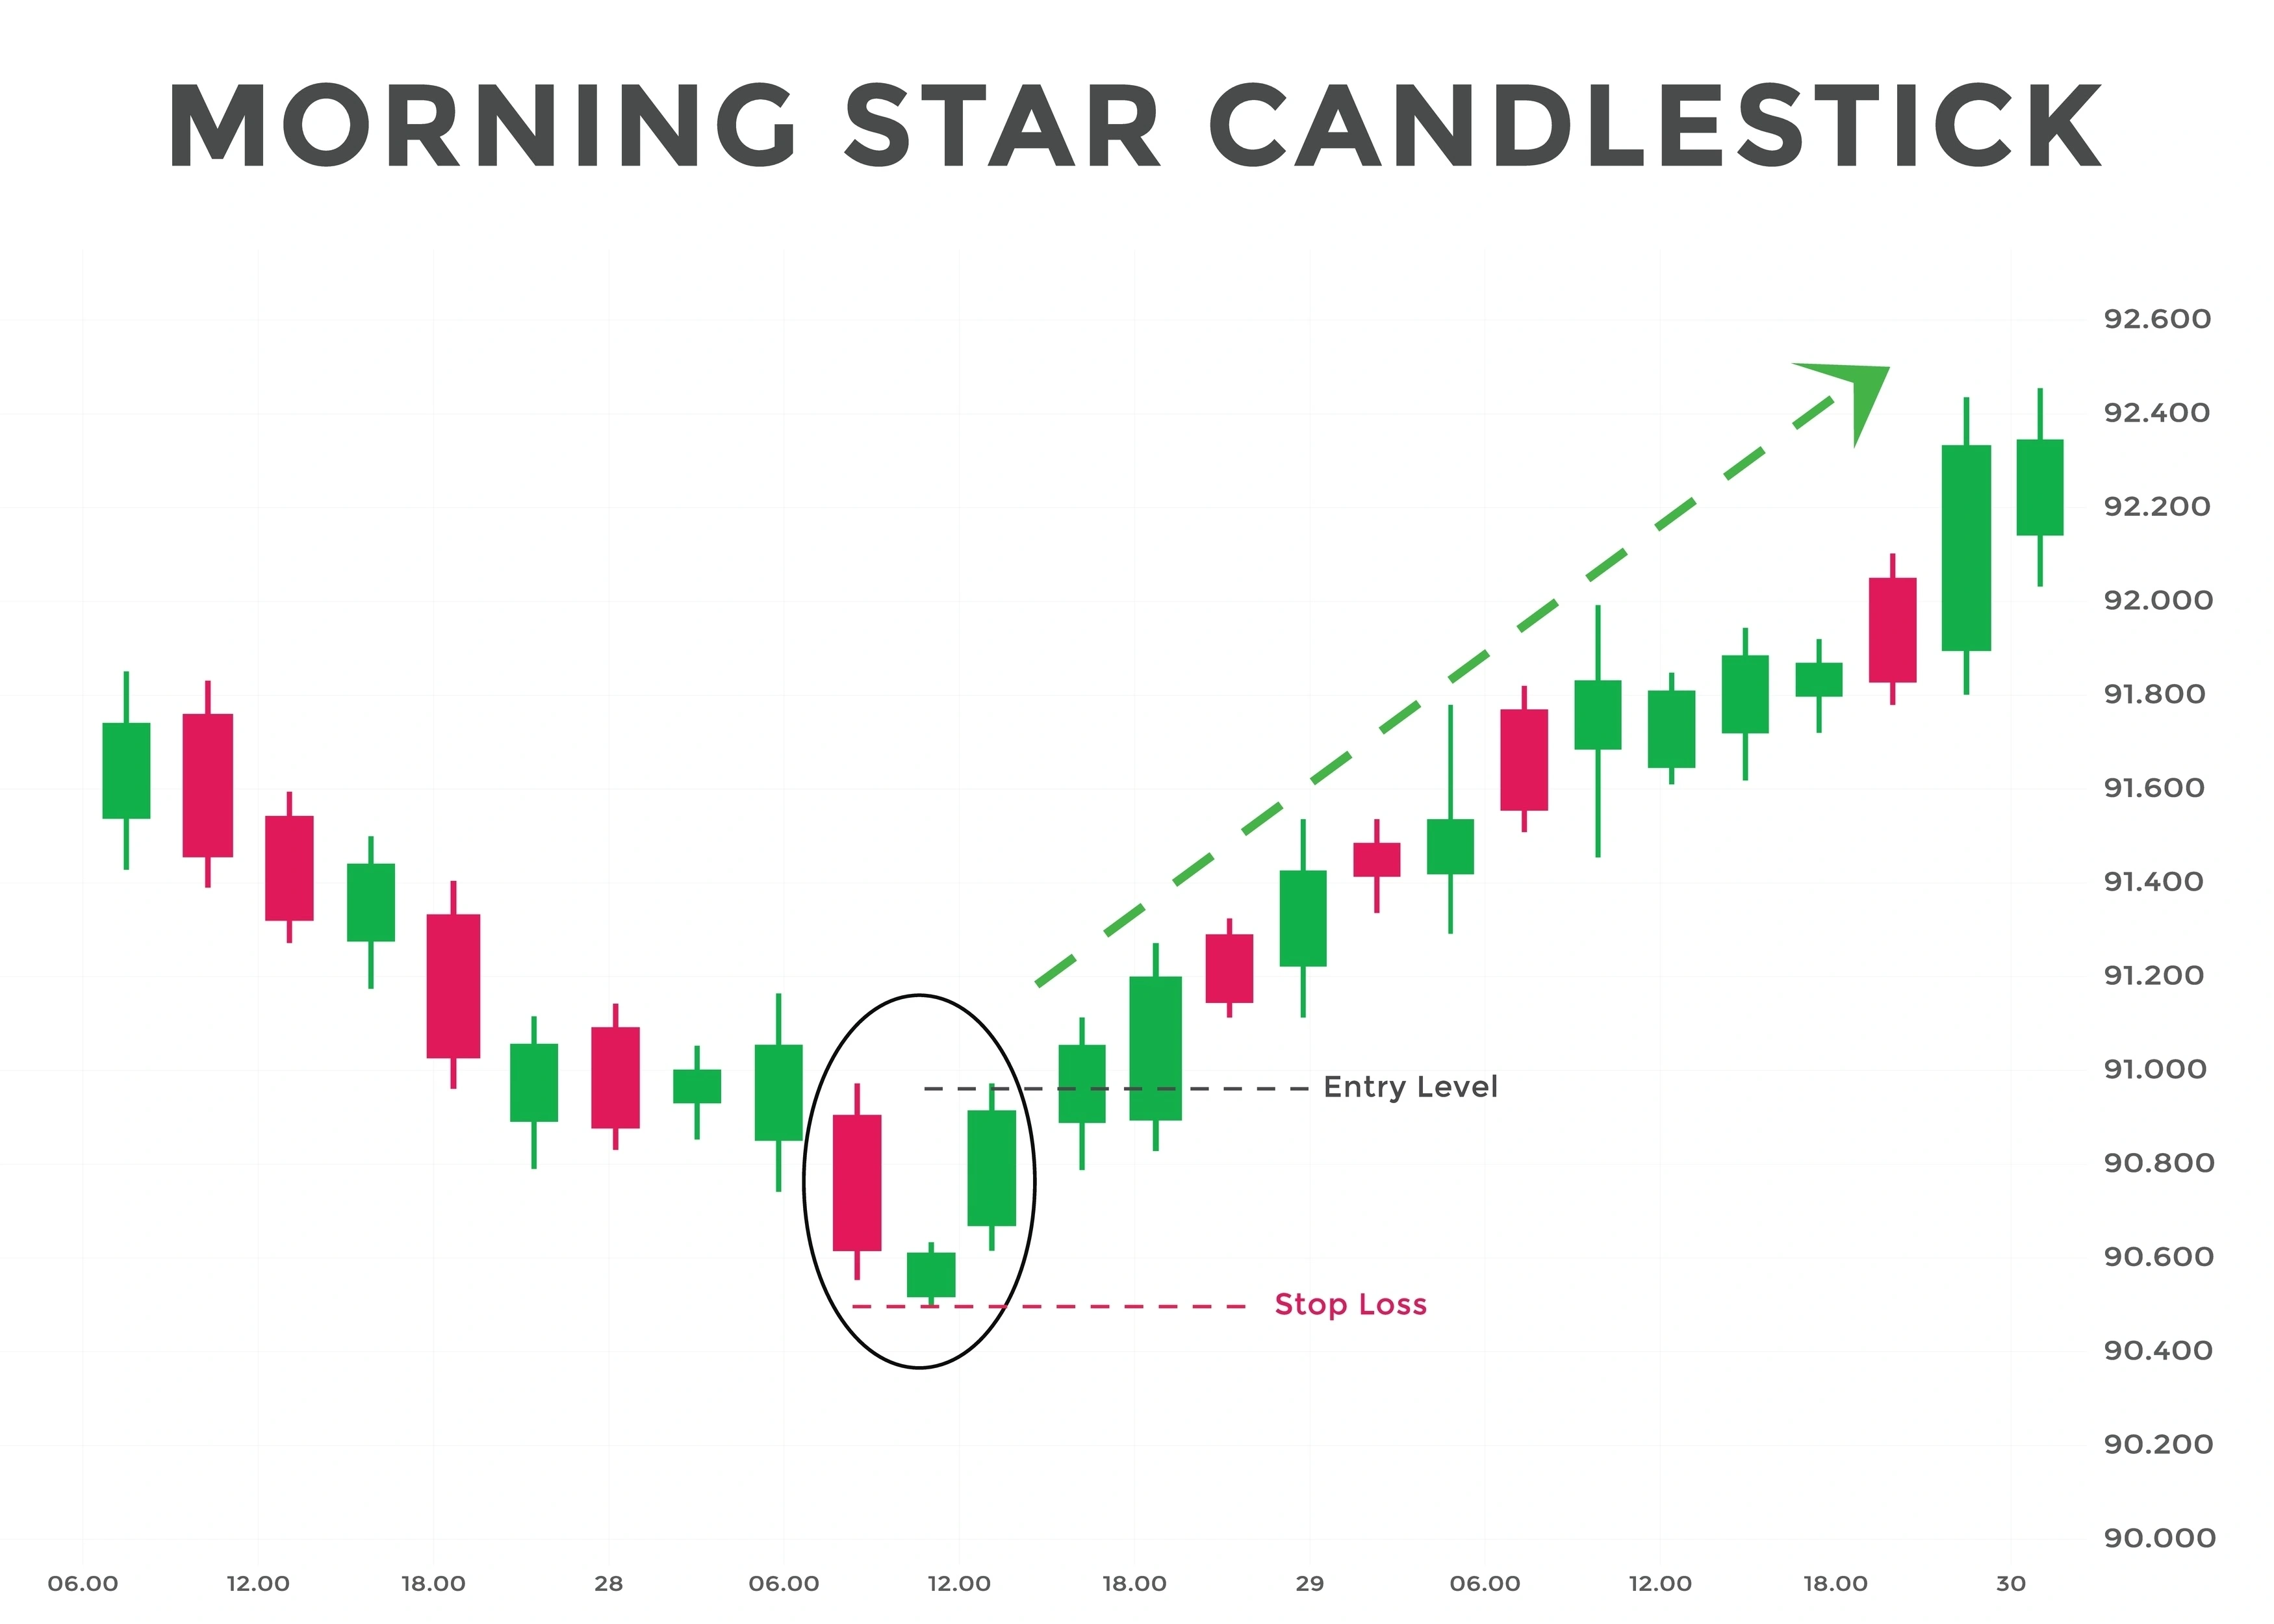
Step 1: Check the Location A Morning Star is only valid if it appears after a sustained downtrend. Its reliability skyrockets if the "Star" (Day 2) bounces perfectly off a major technical support zone, such as a multi-month trendline or the 200-day Moving Average.
Step 2: Verify the Volume In the NEPSE, volume validates price action. You want to see rising volume on Day 3. If that final green candle pushes up with massive turnover, it means mutual funds and large investors are driving the price, making the reversal highly legitimate.
Step 3: Execution & Risk Management
Entry: You can confidently enter the trade near the close of Day 3 (around 2:50 PM) when the pattern is visibly completing, or right at the open on Day 4.
Stop-Loss: Place your strict stop-loss just below the lowest point of the Day 2 "Star" candle. If the price breaks below this ultimate bottom, the pattern has failed.